Market Volatility Bulletin: Is Contango The Only Way?
vixcentral.com
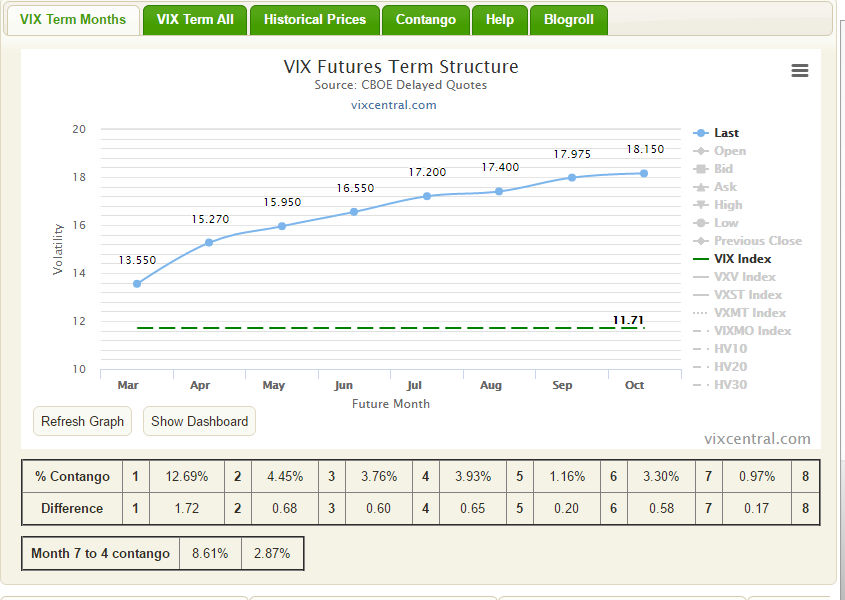
you can look at the shape of the forward VIX futures contracts at this site.
Feb. 23, 2017 11:14 AM ET|
CNBC 8:30 EST
After a low-volume, slightly bullish overnight session, ES futures (NYSEARCA: SPY) were able to revisit yesterday's high levels before falling off slightly. Look for at least one more attempt from market participants to keep the bull party going. VIX is roughly unchanged before the opening bell.

US equities had a mixed reaction yesterday as the markets attempted to evaluate the release of Fed Minutes from the earlier February meeting, read the full release here. After the release, Fed fund futures priced in an approximate 22% chance of a rate hike in March, up from 17% on Tuesday.
The market's initial reaction to the release was quite muted, as the S&P failed to break out of its prior day's range on the news. The Federal Open Market Committee meets next on March 14 th.

CNBC: Wednesday Close
The S&P closed slightly lower yesterday, with the energy sector being the biggest drag at -1.59%, and with four other sectors finishing lower. The utilities sector was the overachiever yesterday, logging an approximate half-percent gain.
The Dow Jones (NYSEARCA: DIA) closed at record highs for a 9th straight session, something the 30 company, price-weighted index has not achieved since January 1987. Also noteworthy during that month, the Dow crossed 2,000 for the first time ever.
Yesterday was the fourth straight day the VIX opened higher, but ultimately failed in any continuation attempts above the 12 level.
Article Shout-Out
Today the article we feature for our readers was written by Lance Roberts, and published on SA Tuesday morning. " You Can't Time The Market?" is the question immediately posed by the author, as he chips away at the often-cited Wall Street advice that since nobody can time market tops and bottoms perfectly, it's best to simply stay fully invested 100% of the time.
Mr. Roberts notes that typical money managers will cite studies showing an approximate 50% reduction in returns over the last forty or so years, if you had missed out on just the 10 best days over that time period. While most of us can likely agree that nobody is going to perfectly time the market to their benefit, these studies, illustrated partially in the chart below, seem to assume that even a modest attempt at trimming back positions when prices are elevated, will result in perfect mis-timing of markets.
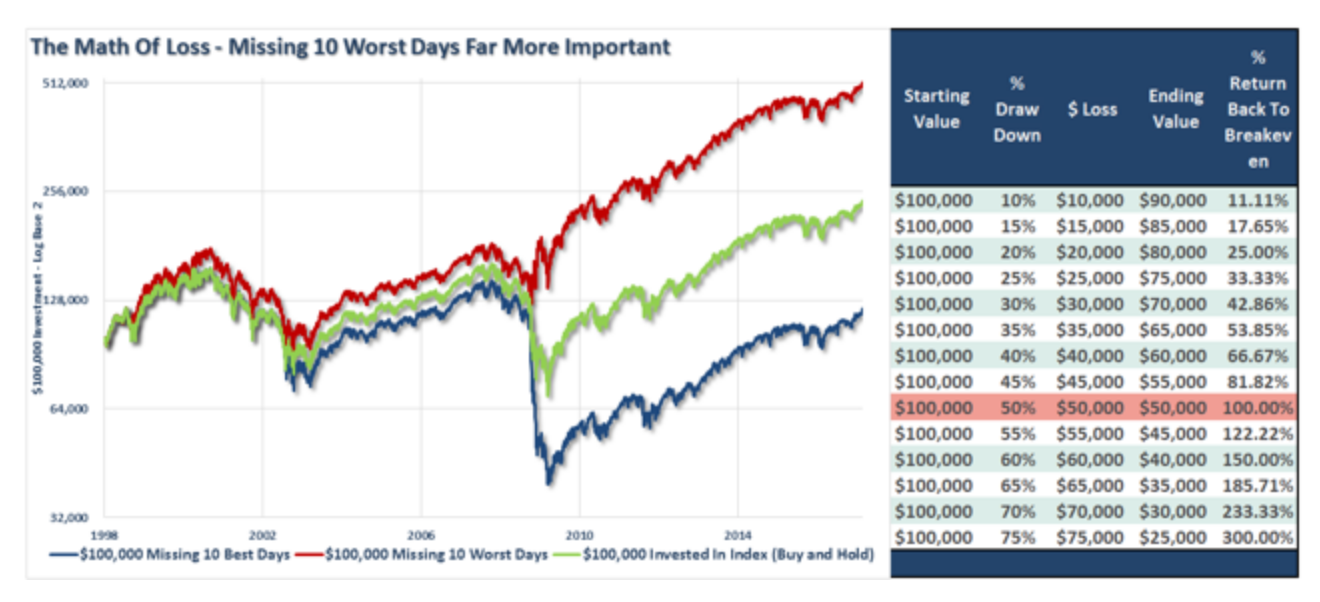
Also, illustrated in the above chart, the author notes the increased returns possible from being out of the market on only the 10 worst days over the last forty years. Mr. Roberts points out that what can best benefit investors' long-term goals is clearly avoiding major market drawdowns.
The author notes that typically the financial industry fails to mention the benefits of avoiding market downturns, most likely due to it not being in their best interests to do so. To quote directly from Mr. Roberts' article, "the finance industry makes money when you are invested - not when you are in cash. Therefore, it is of no benefit to Wall Street to advise you to move to cash."
While the author certainly isn't an advocate of trying to time the markets in a day-to-day sense, and, to be clear, we likewise don't believe it will benefit most investors, he does offer some advice that the typical individual may be able to use. Among others, Mr. Roberts mentions not being afraid to cut exposure during certain periods, possibly trimming back winning positions or sectors to their original weighting. He also mentions getting out of losing positions during these times, as he says, "if a position was not working in a rising market, it likely won't work in a declining market." Keep the cash raised from these activities on the sidelines until the next buying opportunity shows up.
To repeat, the takeaway here should not be that attempting to perfectly time the market, in the sense of moving back and forth from 100% cash to 100% invested, will benefit you, as it likely won't. What we'd like our readers to glean from this article is the advice that it is possible to make beneficial decisions about whether the market currently offers you a good value.
Thoughts on Volatility
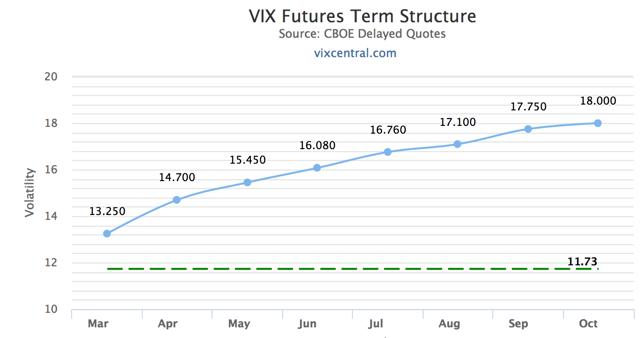
Yesterday we mentioned the possibility of a mixed VIX futures curve as levels move back towards historical averages. That is to say, there is the possibility of the curve exhibiting both backwardation and contango over different parts of the curve. As a reminder, here is the VIX term structure as it sits currently, a market squarely in contango.
In a few of the charts below, note that in certain periods of elevated VIX levels, the term structure does not move seamlessly from contango to backwardation. As we've mentioned previously, early on in 2015 we experienced periods of elevated volatility.
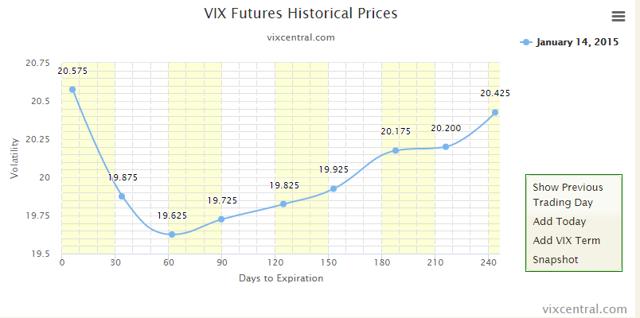
Above we see the example of what VIX term structure looks like when the market is likely pricing in a specific binary event in the near future. Front-month levels are elevated, with the market charging a steep premium relative to 60- or 90-days out.
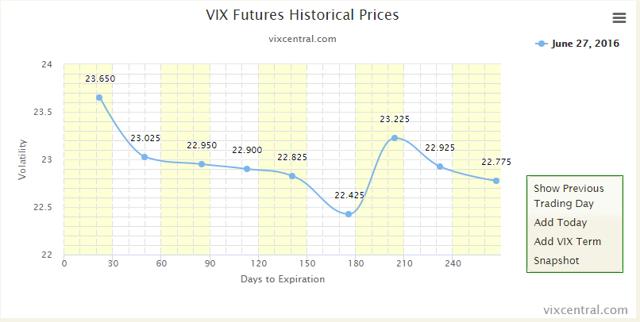
Observe in this chart, taken immediately after the Brexit voting results came through, the front-end of the VIX curve, even out to approximately 6-months to expiration exhibited backwardation, with the expectation that volatility would come back down slightly in the future. Interestingly, here we see the back-end of the futures curve in contango, with deferred-month sellers demanding a premium over mid-term.
We bring these examples to you today to show that there are many possibilities for the VIX futures term structure other than what we've seen recently, contango throughout the entirety of the curve. Look for us to explore these scenarios more in the future, with possible strategies to play a VIX market in either backwardation, or for those times when the term structure is mixed.
Because many who have an understanding of VIX and volatility ETPs are familiar with the basic structure of ETPs, they sometimes take the contango shape for granted. Others know that there are times when we "briefly" move into backwardation: this is always time to buy the S&P dip (we're joking)!
In reality, the VIX term structure can weigh in a lot of differing factors. As such, the term structure can take and then even sustain some very atypical shapes. Beware the conditioning of the past several years that VIX term structure always needs to quickly return to "normal" in a rapid and orderly manner.

"Organic vol" - the kind found on the underlying S&P as opposed to VIX - tamped down for the one-week and one-month expiries and nudged higher for the one-quarter expiry. There were not big changes to implied volatility in any of the cases. Given how quiet yesterday's trading session was, perhaps this makes sense.
Seven-day vol (Mar1 contract) on Monday was 7.7; it fell a bit yesterday and into the morning, but it is still holding out for a bit of whippiness.
What is perhaps more interesting is one-week vol moving down .4 vol points and one-quarter vol moving up .2 vol points. We see this as the market having less to fret about over the near term, paired with increasing anxiety over the period beyond that… maybe French elections are showing up on investors' too-consider list?
Tracking the Trade*(please read disclosures):
Last week we began a new trade to follow through to tomorrow, when we decided to close out. Our trade specifications were as follows:
Trade horizon: Friday, Feb 24Instrument: "ES" - S&P e-mini futures and futures optionsOver the next several days we focused on the time-fly. Timeflies can be a good way to adjust expirations on an existing position, or as a way of positioning on a calendar for a move that you believe is coming, but not necessarily right around the corner.
VIX traders should give timeflies some consideration, as they can have interesting implications for VIX contango.
Thesis: Strategy
The market may hang out in this region before moving on to something else. We've determined we want short exposure to ES, but we believe that the market could easily hang out in its current region for awhile.
We also believe that the S&P is quite overheated, but that it may be due to calm down or pull back. This may enter considerations as we build and modify our timefly.
* Note that our strategy here is fairly simple. A lot of investors or traders put a great amount of thought into their strategy: developing a firm rationale for why they want to invest or trade a certain way. We agree that strategy matters; but tactics and mechanics are often overlooked when determining how to let a strategic directive play out.
Update: ES is up about 40 points from where we initiated our trade on Monday at ES 2322; about 7 points higher from yesterday.
Tactics
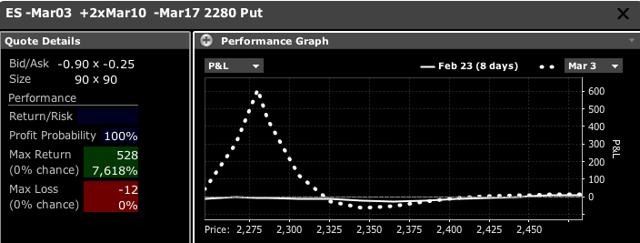
Last week we determined that timeflies could be an interesting way to take a position given this particular thesis. A visual on the payoff can be seen below. The solid line was P&L movement as of yesterday (the markets were actually closed); the dotted line shows the payoff on the day of expiry on March 3.
Source: Interactive Brokers
The visual demonstrates that our max profit lives at 2280; this is where the Mar3 put expires, and would equate to max profits for the spread.
Last Wednesday we discussed the "delta" on this trade. Delta has several different interpretations in options trading, but one of the most important is that delta is the change in the value in an option (or spread's) value if the underlying, in this case ES, moves up by one point.
"How would you modify this position?"
Let's examine today's option sensitivities on our five timeflies:

We can see that today's Delta is zero (Delta row, Current column). Gamma is negligible here, but goes quite negative down at the 2280 range; theta is positive nearly across the board, but gets quite strong at lower levels (Theta row, -3% column).
For further insight on the spread's Greeks, we wrote last Thursday about the spread's gamma; we furthered our analysis on gamma in last Friday's bulletin. Yesterday we covered theta.
Honestly we likely would not modify. The fact is that our Greeks look pretty good at these levels. Check out how incorrect our basic strategy (premise has been over the last three weeks! We thought the market may hang out for awhile and catch its breath near 2320… it's been nothing but up! That said, the spread made money: not a lot of money mind you (it was designed to be a low-amplitude trade)… but still up.
We determined at the trade initiation that we were going to close the trade on Feb 24. The truth of the matter is that we'd do nothing right here. We could see closing here today and moving onto something else tomorrow.
Traders often overtrade. That is only good for your broker. You should always have a good reason to trade: never trade out of boredom or trying to over-manage a position.
This was intended to be a low-impact trade that showed off some of the features of a timefly position. We earned a modest profit (about $250) - while being dead wrong on our thesis - and that we have had a chance to demonstrate some visuals and characteristics of this under-utilized spread. We should sit on our hands and do nothing today!
Mechanics
" But if you HAD to do something, what would it be?"

We'd hold out for a decent buy on this spread, and try and limit into this at around $.60. We'd do it one time vs. our current position. The trade mod looks as follows:
Sell the Mar10 2405 call.Buy three of the Mar17 2280 put vs selling three of the Mar 10 2295 put.We already own ten of the Mar10 2280 put vs. being short five of the Mar17 2280 put. Selling three Mar10s with a slightly higher price (fifteen handles) in order to close out the majority of our Mar17s - financed with a dumpy call in a crazy over-bought market - appears like a legitimate approach in our view.
Again, we wouldn't trade this at all. We'd just hold on and close either today or tomorrow and move on to something else. But if we had to modify, this would be a candidate.
For an excellent question (and we hope you'd agree an equally excellent response) from a commenter who asked about the bid-ask, please read the mechanics segment of last Wednesday's bulletin.
Closing Thoughts
The volatility environment is still quite low, but it doesn't seem to want to throw in the towel quite yet; last Wednesday gave readers every reason to pummel VIX, and it spiked. The VIX has had every reason to get wrecked (nine straight days of all-time highs for the Dow!!): it has not.
Vol is still low, but it feels "tense". Our ES trade was a low-amplitude trade in terms of P&L, which isn't so bad given how screwy the market has been of late.
Have any questions or suggestions? Let us know! Please do ask questions or leave comments. We have gotten some awesome content and questions right from our readers. We really appreciate that.
Please consider following us.
Disclosure: I am/we are short SPY.
I wrote this article myself, and it expresses my own opinions. I am not receiving compensation for it (other than from Seeking Alpha). I have no business relationship with any company whose stock is mentioned in this article.
seekingalpha.com
---------------------------------------
comments on the seeking alpha article
------------------
Comments 10
Add Comment

Chaffey
Comments (1958) | + Follow | Send Message
Today must be good news for those in UVXY and TVIX. Dow and SP500 are flat and gains . This must mean some possibility of event in the future has futures scared ...Right?
23 Feb 2017, 12:07 PM Report Abuse Reply0 Like

The Balance of Trade, Contributor
Comments (112) | + Follow | Send Message
Author’s reply »
Good observation Chaffey. The traditional correlation seems to be getting sloppy; we think VIX is -thinking- about waking up. As we said yesterday, that doesn't mean it has to go nuts; but perhaps markets are considering that lowest-five percentile status is not warranted in the current environment.
23 Feb 2017, 12:11 PM Report Abuse Reply1 Like

dali lama
Comments (1499) | + Follow | Send Message
It apparently hasn't been in the mood though yet....its still sputtering. It tried to breakout yesterday early, then today....its scaring when the TLT, UVXY, SPY all are moving in union with one another....As long as the faith in the dollar holds up....and volume stays low....its easy to see it all get smashed to pieces.
23 Feb 2017, 12:50 PM Report Abuse Reply0 Like

The Balance of Trade, Contributor
Comments (112) | + Follow | Send Message
Author’s reply »
Hi there dali - market action has been "puzzling" to say the least. We don't believe you ever want to argue to fervently with the markets, but we have to confess that some of the correlations, levels, and movements are quite odd.
This is what you get though when you have a hyperactive set of central banks and lots of complacency.
23 Feb 2017, 12:54 PM Report Abuse Reply1 Like

Chaffey
Comments (1958) | + Follow | Send Message
It seems to peak around 11am eastern time every day for the last 5 days or so. I need to check if Europe is closing about that time. Maybe it is uncertainty about the French election...or not?
23 Feb 2017, 12:58 PM Report Abuse Reply0 Like

Chaffey
Comments (1958) | + Follow | Send Message
Yeah...it looks like London closes at about 11 or so. Maybe European Traders cause the buildup in the morning and then American traders aren't worried about anything so it wanes.
Maybe a trade right now is to buy UVXY last thing in the day and then sell before 11am . Might be good for 2% everyday . On 10G's it's a living...Ha Ha !
23 Feb 2017, 01:04 PM Report Abuse Reply0 Like

Chaffey
Comments (1958) | + Follow | Send Message
11am or closing London is a little less than halfway through each day on this chart.
bit.ly
23 Feb 2017, 01:09 PM Report Abuse Reply0 Like

The Balance of Trade, Contributor
Comments (112) | + Follow | Send Message
Author’s reply »
Chaffey you are correct that a lot of our "drawdowns" in S&P (could we really call them that) have tended to occur early in the day over the last several weeks. We nearly always finish strong.
Nine straight all-time highs on Dow - pretty nuts! Nine straight up days is difficult to string together period.
Your trade idea actually may be something that traders are looking at. Not literally that idea, but people look for patterns.
Thanks for the chart!
23 Feb 2017, 01:40 PM Report Abuse Reply1 Like

Bob Cirillo
Comments (117) | + Follow | Send Message
There has been some interesting action the last few days. The spot VIX has hardly budged, but the futures are rising.
23 Feb 2017, 03:37 PM Report Abuse Reply0 Like

The Balance of Trade, Contributor
Comments (112) | + Follow | Send Message
Author’s reply »
It is interesting Bob. Spot's just hanging in there. Some of the contracts a ways back feel like they are doing something other than just falling.
French elections in May?
23 Feb 2017, 04:11 PM Report Abuse |


