Some very good analysis, ... thanks for taking the time and I see one of your trend-lines points to the mid $1,360 range, just as what I found in my charts.
Maybe we are focusing too much on the daily action and not so much on the long term picture, just as you say, and the RSI can continue moving in oversold for a longtime, as you point out, just like the other indicators can, I've also read several articles pointing out that Silver has become in short supply and it will hit retail sooner or later.
At this point I'm not too sure the miners are any farther ahead than where gold is, .. I think gold is still leading the way right now, the miners have failed to move above the range they achieved in the past week, ... here is a short term view (30-day) of the GDXJ and gold, ... and gold is still above the juniors both in price and on a percentage bases. The miners might have to get going again before we see further rise in gold, and those gaps and pivots below arent helping them rise.

~~
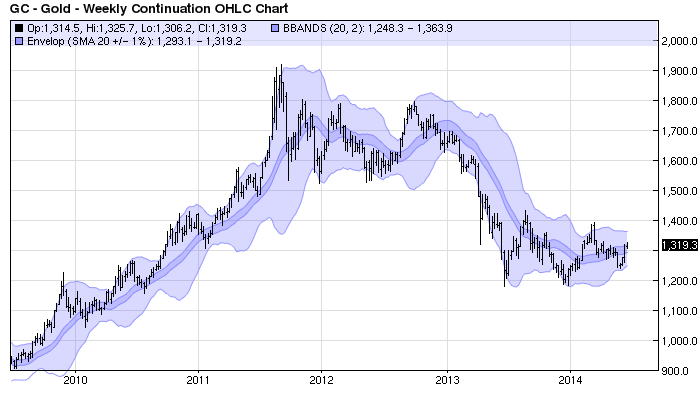
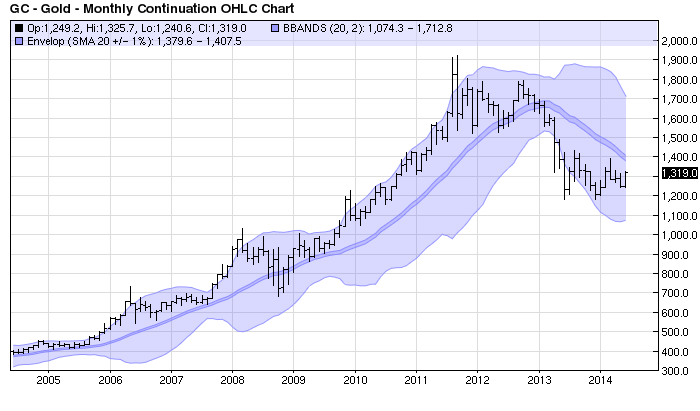
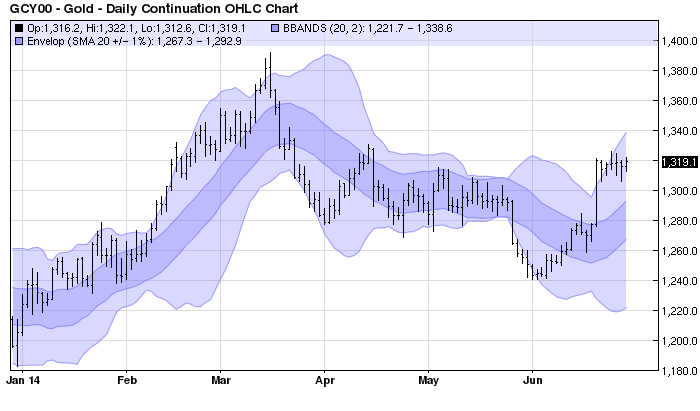
Looking at your longer term charts reminded me to take a look at the bigger picture on gold and one particular indicator we rarely look at are the Bollinger Bands and gold's bands sure look like they are gaining ground.
Both the weekly and the monthly have room to rise within the band, the weekly has recently moved into its center, while the monthly has come off of its lows as it nears its center, ... its still going sideways below center but these two charts tell us that once gold gets going again it has a lot of room to run, just as they did on the way down, they can hug the upper line for months, like we see on the way up.
Weekly:

~~
Monthly: Still going sideways below center, ... below the center envelope

And Daily: Which shows that we are now in a bullish phase once again, it needs to hold above the bands center, another spike is overdue if we are to continue the bullish phase, but the miners are stuck.

|


