Right now the rich have most of the money, but Trump was voting in to spread it out.
GDPHow Much Money Exists in the World Per Person?
February 21, 2025
By Pallavi Rao
Graphics/Design:
See this visualization first on the Voronoi app.
How Much Money Exists in the World Per Person?This was originally posted on our Voronoi app. Download the app for free on iOS or Android and discover incredible data-driven charts from a variety of trusted sources.
This chart explores a hypothetical question: how much money exists in the world per person?
Defining “all the world’s money” is complex, with multiple ways to calculate it. Here, we use global M2 money supply at the end of 2024, sourced from CEIC Data.
See the final section for an explanation of this metric, what it measures, and why economists track it.
Population data is sourced from the UN World Population Prospects 2024.
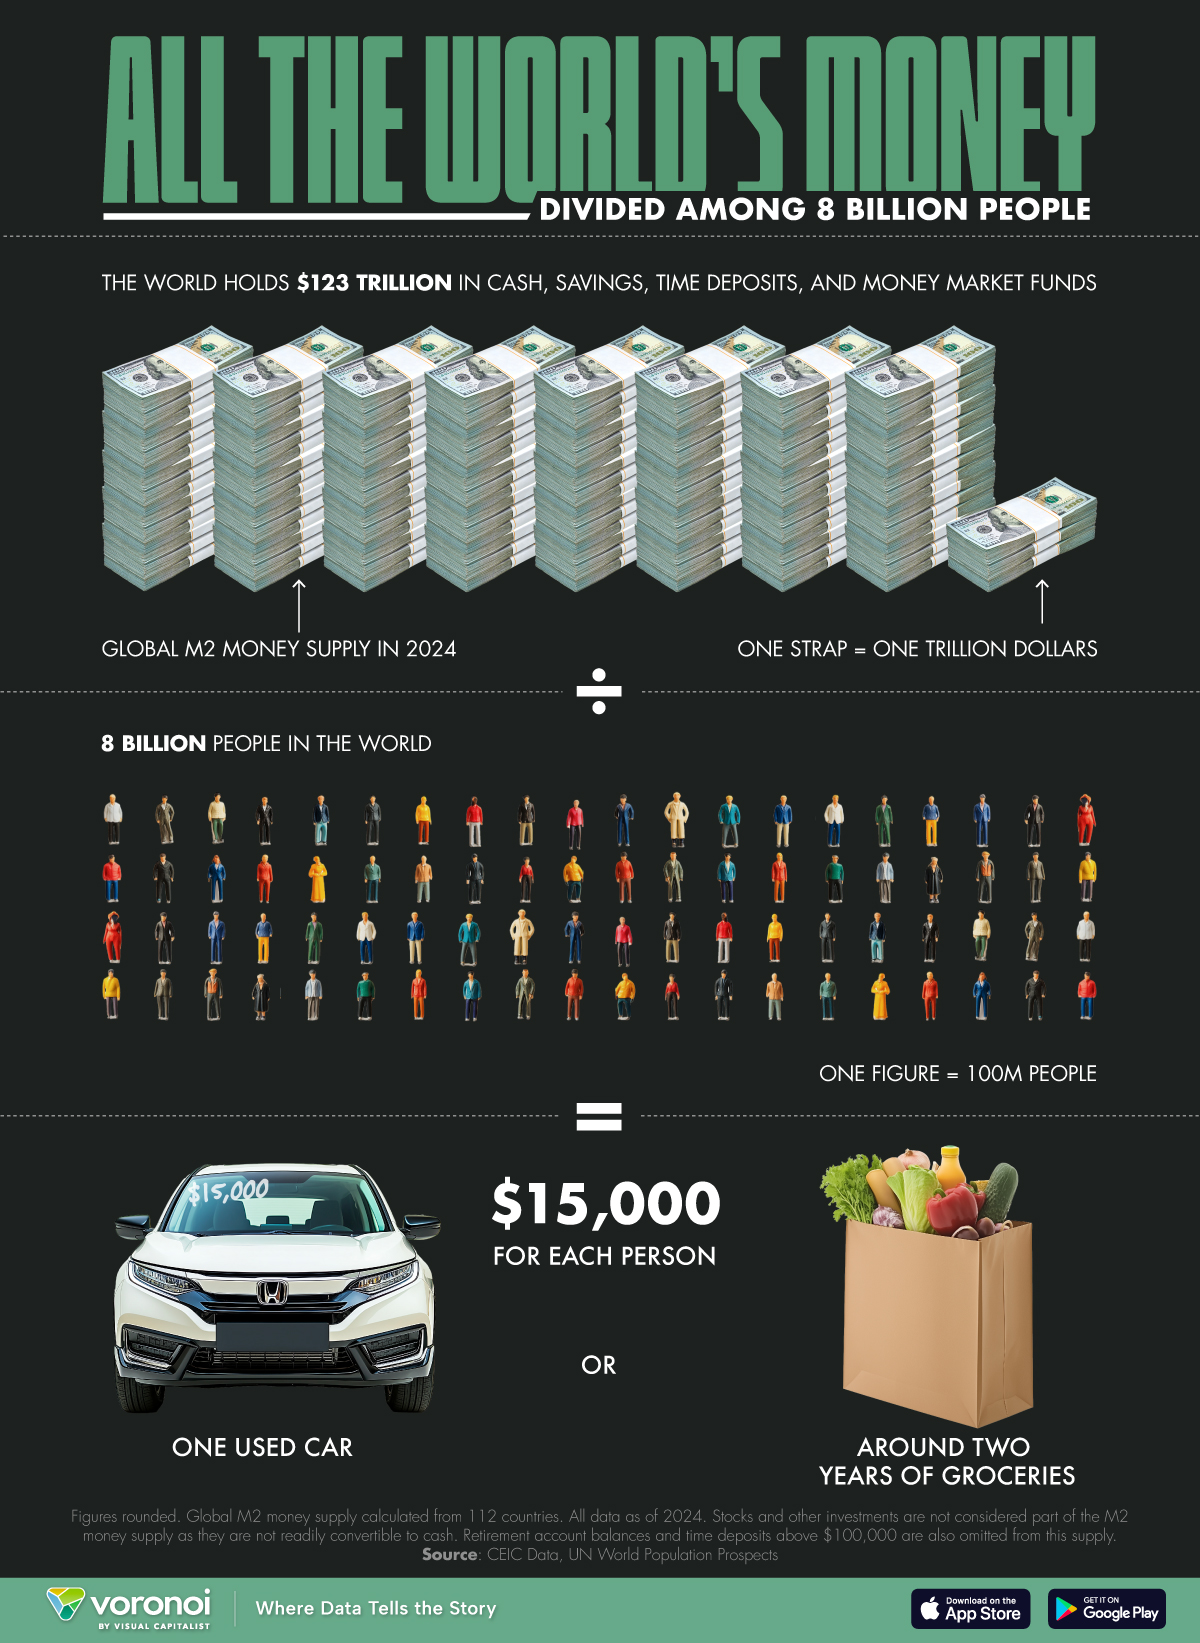
Dividing the World’s Money EquallyAt the end of 2024, there was approximately $123 trillion in cash, savings, and money market funds around the world.
Dividing by 8 billion people equals only around $15,000 for every single human being.
AssumptionsFigures|
| M2 Money Supply 2024 | $123,313,639,860,000 | | World Population 2024 | 8,161,973,000 | | Dividing it equally | $15,108 |
Importantly, this does not include everything in real estate, shares, or any other kind of illiquid investment.
So, what can $15,000 get you?
Not a lot. We made a list for context:
- One used car
- Or, about four months of rent in NYC
- Or, two years worth of groceries
- Or one, really expensive, gaming PC
This figure puts the spotlight on how unequal money distribution is in the world.
What is M2 Global Money Supply?M2 money supply measures all the money people have easily accessible, like cash, checking accounts, and savings accounts.
It’s a way to see how much spending power is out there, which can give clues about where the economy might be heading.
How much money is circulating in the economy can influence GDP. For example when governments send cash payments to households, they’re essentially increasing the money supply.
If output doesn’t rise in tandem, then prices can rise, leading to inflation and impacting nominal GDP.
As a result, controlling money supply is a critical responsibility for governments and central banks around the world. They do this by changing reserve requirements and key lending rates, and buying (or selling) securities.
A Visual Breakdown of Who Owns America’s Wealth
March 4, 2025
By Pallavi Rao
Article/Editing:
See this visualization first on the Voronoi app.
Use This Visualization
A Visual Breakdown of Who Owns America’s WealthThis was originally posted on our Voronoi app. Download the app for free on iOS or Android and discover incredible data-driven charts from a variety of trusted sources.
There are two types of households in the U.S.: the rich half and the poorer half.
And the data is quite striking in this regard.
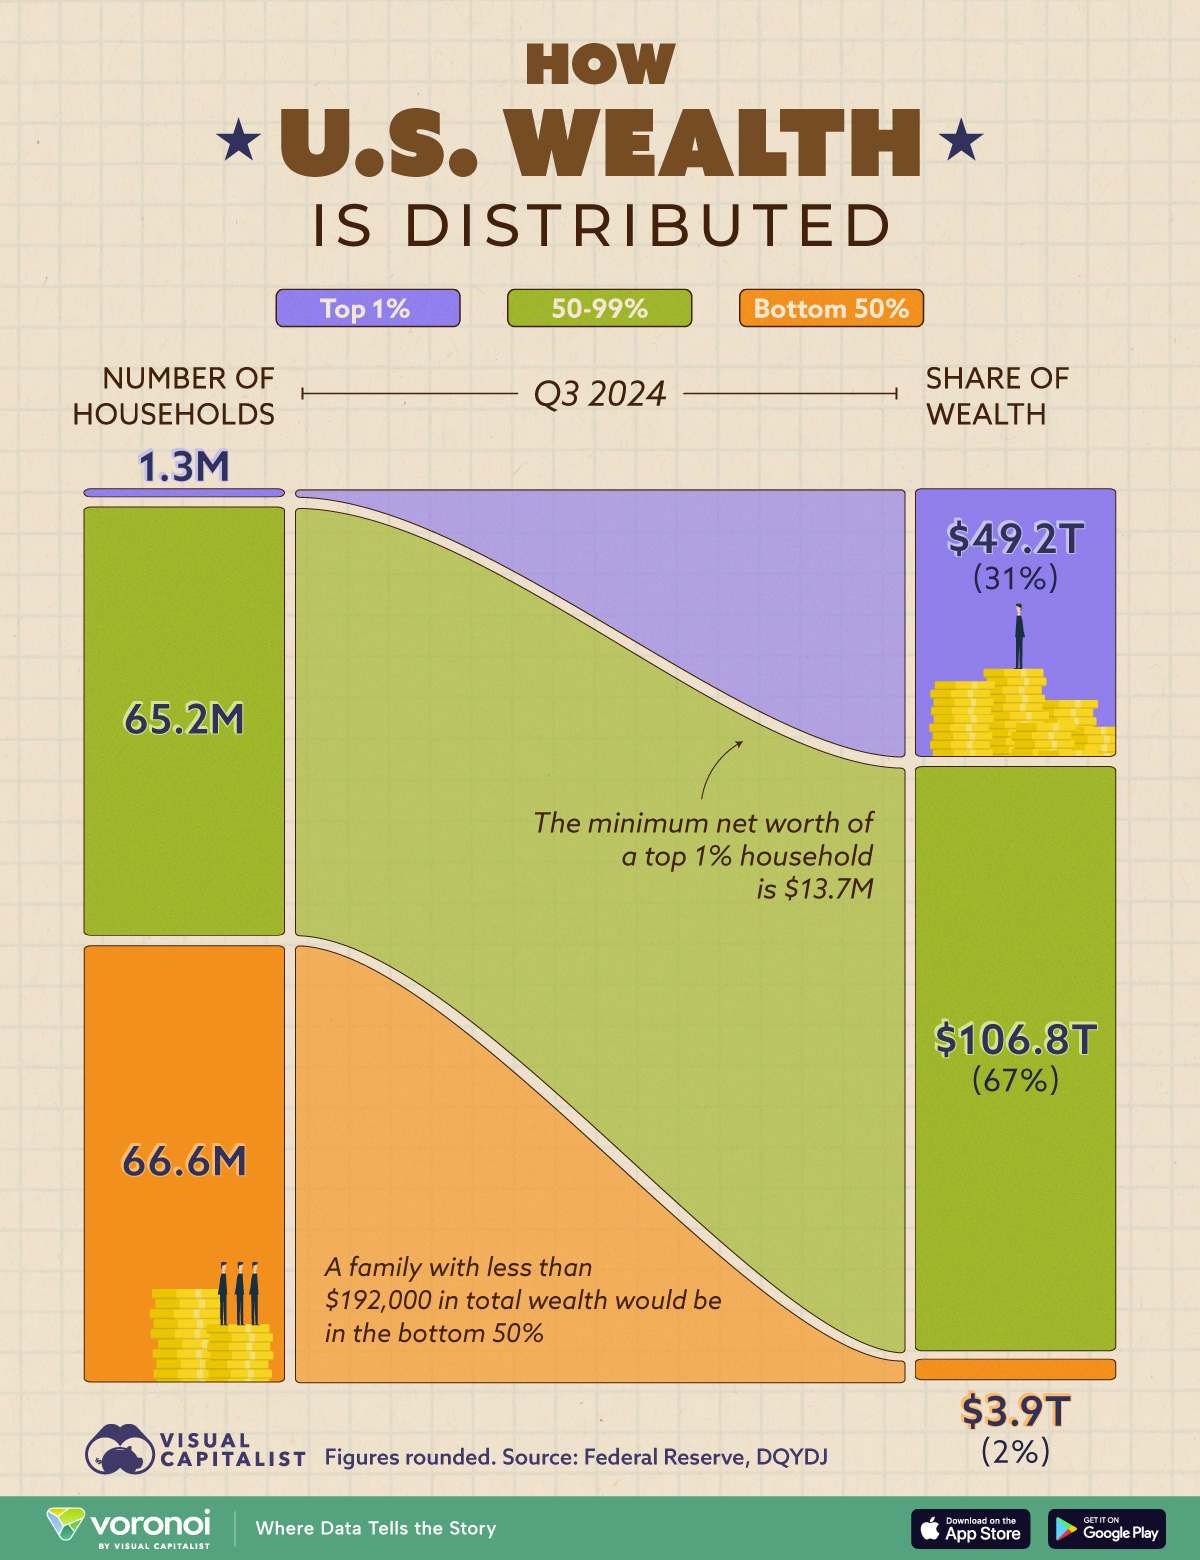
This graphic breaks down America’s wealth (the total net worth of all U.S. households) by wealth percentile, and lists the number of households in each percentile.
Data for this chart is sourced from the Federal Reserve as of Q3, 2024.
U.S. Wealth Distribution is Top HeavyFor reference, the total net worth of all U.S. households is close to $160 trillion.
Wealth BandsHouseholdsWealth OwnedShare of
U.S. Wealth|
| Top 50% | 66.5M | $156.0T | 98% | | Bottom 50% | 66.6M | $3.9T | 2% |
The rich half own about $156 trillion (or about 98% of it). The poorer half only own about $4 trillion.
Breaking down that top half even further, the top 1% (1.3 million families) owns about $49 trillion (or about one-third of the total share) by themselves.
Wealth BandsHouseholdsWealth OwnedShare of
U.S WealthTotal133.1M$159.9TN/A|
| Top 1% | 1.3M | $49.2T | 31% | | 50-99th Percentile | 65.2M | $106.8T | 67% | | Bottom 50% | 66.6M | $3.9T | 2% | |
And going even further, about half of that $49 trillion is owned by the top 0.1%. That’s only around 136,000 households and includes all of America’s wealthiest people.
Demographics of Wealth BandsThe Federal Reserve also has some insight of how much one needs to own in each wealth band.
From their last analysis in 2022, households with less than $192,000 were the bottom 50% of the country. This band also had a higher concentration Black or Hispanic families without a bachelor’s degree.
On the other hand, to be in the top 10% (not pictured in this graphic), a household needed at least $1.92 million in 2022. Asian and White families with at least a bachelor’s degree were overrepresented here.
To find out the threshold for the top 1%, a different source, DQYDJ, estimated $13.7 million as the minimum household wealth. It takes $62 million for a household’s net worth to be in the top 0.1%. |


