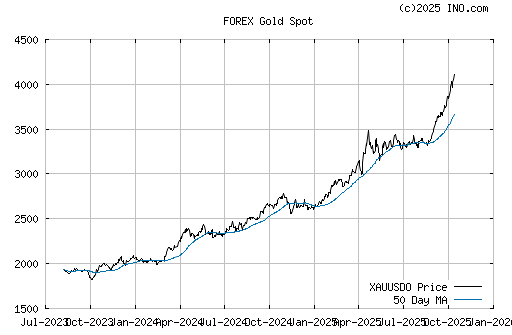
GOLD's mega uptrend and the volatility -
over the past year doesn't look like much -
On the contrary, this chart illustrates Gold's strength -
as it sits near the high side of the rise -
that started in 2001 -
(# 1 LT wave done - # 1 LT correcton wave done -
# 2 LT wave started -
Trends often contain 5-wave Elliott pattern) -
This is the most important picture to keep in mind -
when investing in Gold -
The bull market since 2001 is clearly underway -
This Gold bull market rise is going to make the 1970s -
spectacular rise look small in comparison.
It will take time, but it's powerful because it's more
of a global market today compared to the 1970s.
Aden cont.

Higher Gold bull market is very good for NXG -
The Kemess South Gold & Copper Mine;
produced Au 81,747 ounces of Gold -
and Cu 21.3 million pounds of copper during -
the fourth quarter of 2006 -
Mill throughput during the quarter averaged 49,645 metric
tonnes(mt) per day -
Northgate's Revenue;
for the full year, revenues in 2006
were $411,313,000.00 -
compared with $257,302,000 in the year 2005.
In the fourth quarter of 2006;
was $118,239,000.00 -
compared with $95,651,000 in the
corresponding period of 2005 -
Metal sales in the fourth quarter of 2006 -
consisted of -
Au 77,443 ounces of Gold -
and 20.4 million pounds of Copper -
compared with 91,033 ounces of Gold -
and 23.7 million pounds of Copper -
in the fourth quarter of 2005.
investorshub.com
investorshub.com
siliconinvestor.com |


