Where the World’s Ocean Plastic Waste Comes From
September 6, 2025
By Bruno Venditti
Graphics/Design: See this visualization first on the Voronoi app.
Use This Visualization
Where the World’s Ocean Plastic Waste Comes FromThis was originally posted on our Voronoi app. Download the app for free on iOS or Android and discover incredible data-driven charts from a variety of trusted sources.
Key Takeaways- Five countries account for the vast majority of cumulative plastic waste that escapes and washes up on other countries’ beaches.
- Seven of the top 10 countries on the list are in Asia.
In the past decade, plastic pollution has become one of the most visible environmental issues worldwide. Every year, millions of tonnes of plastic enter the ocean, affecting marine life, coastal communities, and ecosystems.
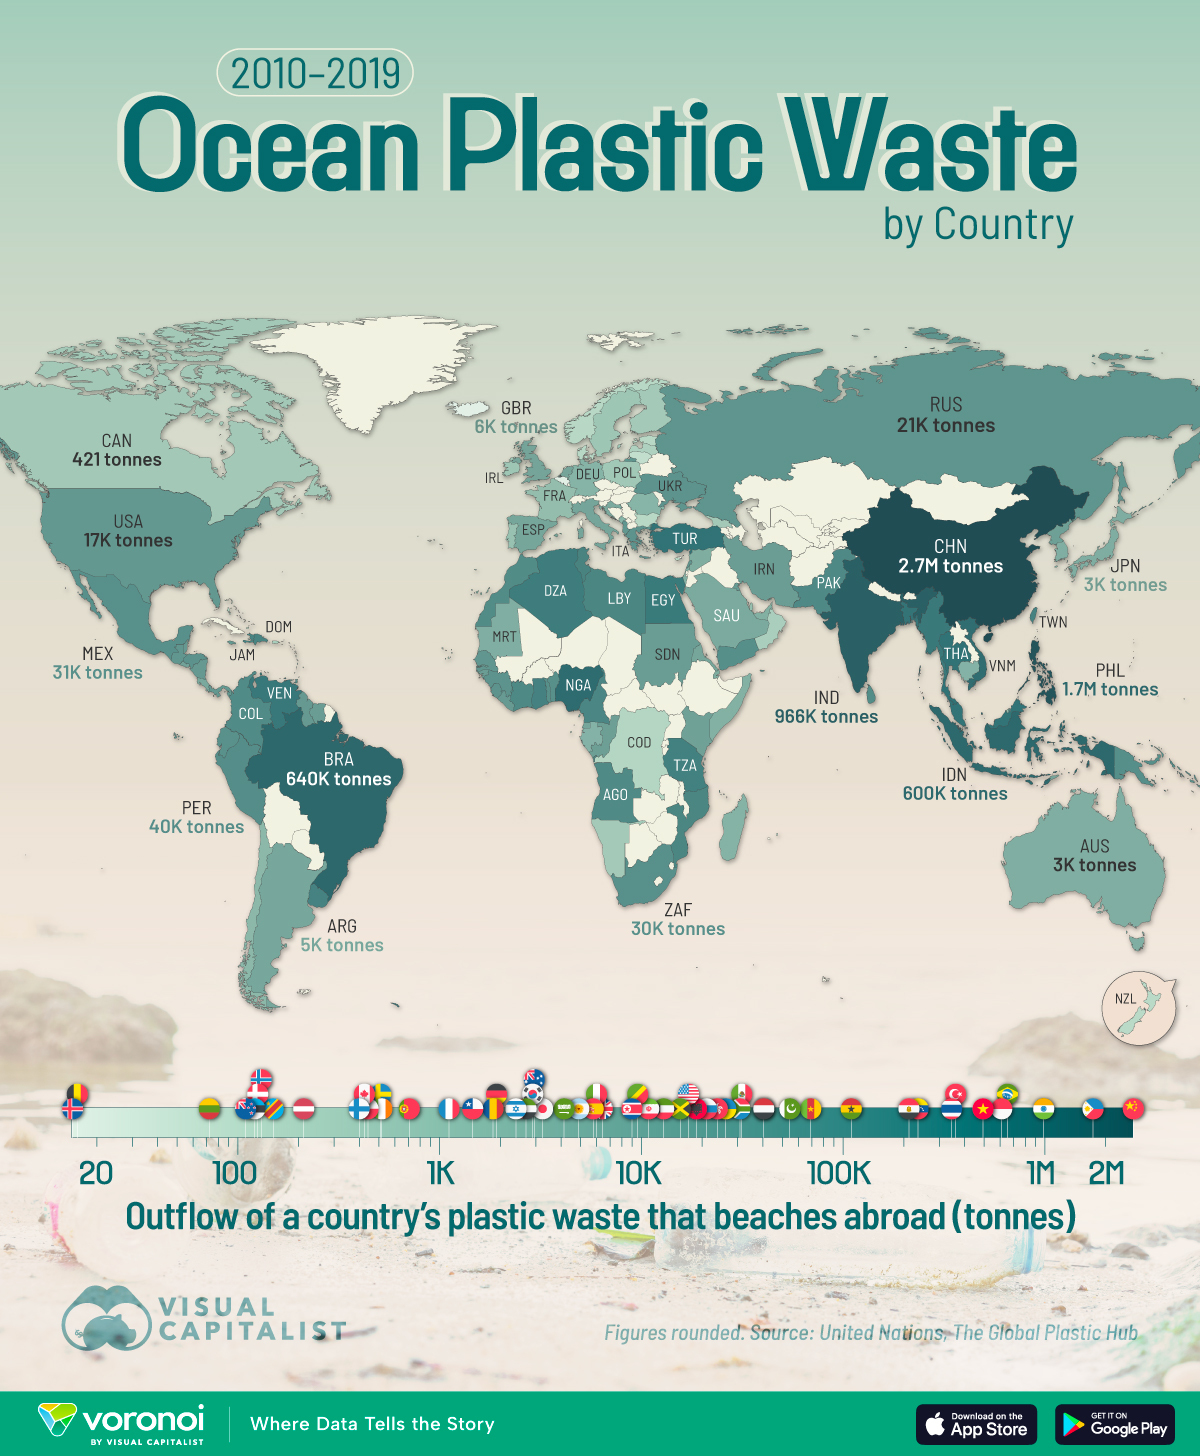
This visualization ranks the countries responsible for the highest cumulative leakage of mismanaged plastic waste that escaped and washed up on other countries’ beaches from 2010 to 2019. The data for this visualization comes from the Global Plastic Hub.
Asia Leads in Ocean Plastic Leakage
China is the largest contributor, responsible for over 2.6 million tonnes of plastic waste that ended up on foreign beaches. It’s followed by the Philippines (1.7 million tonnes), and India (966,000 tonnes). Rapid economic growth, urbanization, and inadequate waste management systems contribute to these high figures.
Seven of the top 10 countries on the list are in Asia, underlining the region’s central role in the global ocean plastic crisis.
RankCountryTonnes (2010-2019)|
| 1 | ???? China | 2,683,631 | | 2 | ???? Philippines | 1,695,260 | | 3 | ???? India | 966,447 | | 4 | ???? Brazil | 639,665 | | 5 | ???? Indonesia | 599,020 | | 6 | ???? Nigeria | 496,841 | | 7 | ???? Viet Nam | 484,457 | | 8 | ???? Turkey | 354,441 | | 9 | ???? Thailand | 338,685 | | 10 | ???? Malaysia | 332,756 |
Plastic Waste Doesn’t Stay Local
Plastic debris often travel thousands of kilometers across oceans, carried solely by currents, wind, tides, and time. For example, the Great Pacific Garbage Patch—a massive swirling zone between California and Hawaii—accumulates plastic from as far as Asia, North America, and South America. The patch spans around 1.6 million km², comparable to twice the size of Texas.
The annual economic costs due to marine plastic pollution are estimated to be between $6-19 billion. According to the OECD, preventing land-based plastic leakage into the ocean across 38 member countries and 10 major plastic waste emitters in Asia and Africa could cost more than $86 billion. |


