Who is Growing? U.S. Natural Gas Leaders
October 13, 2025
By Ryan Bellefontaine
Graphics & Design
The following content is sponsored by Shale Crescent USA
Who is Growing? U.S. Natural Gas Leaders
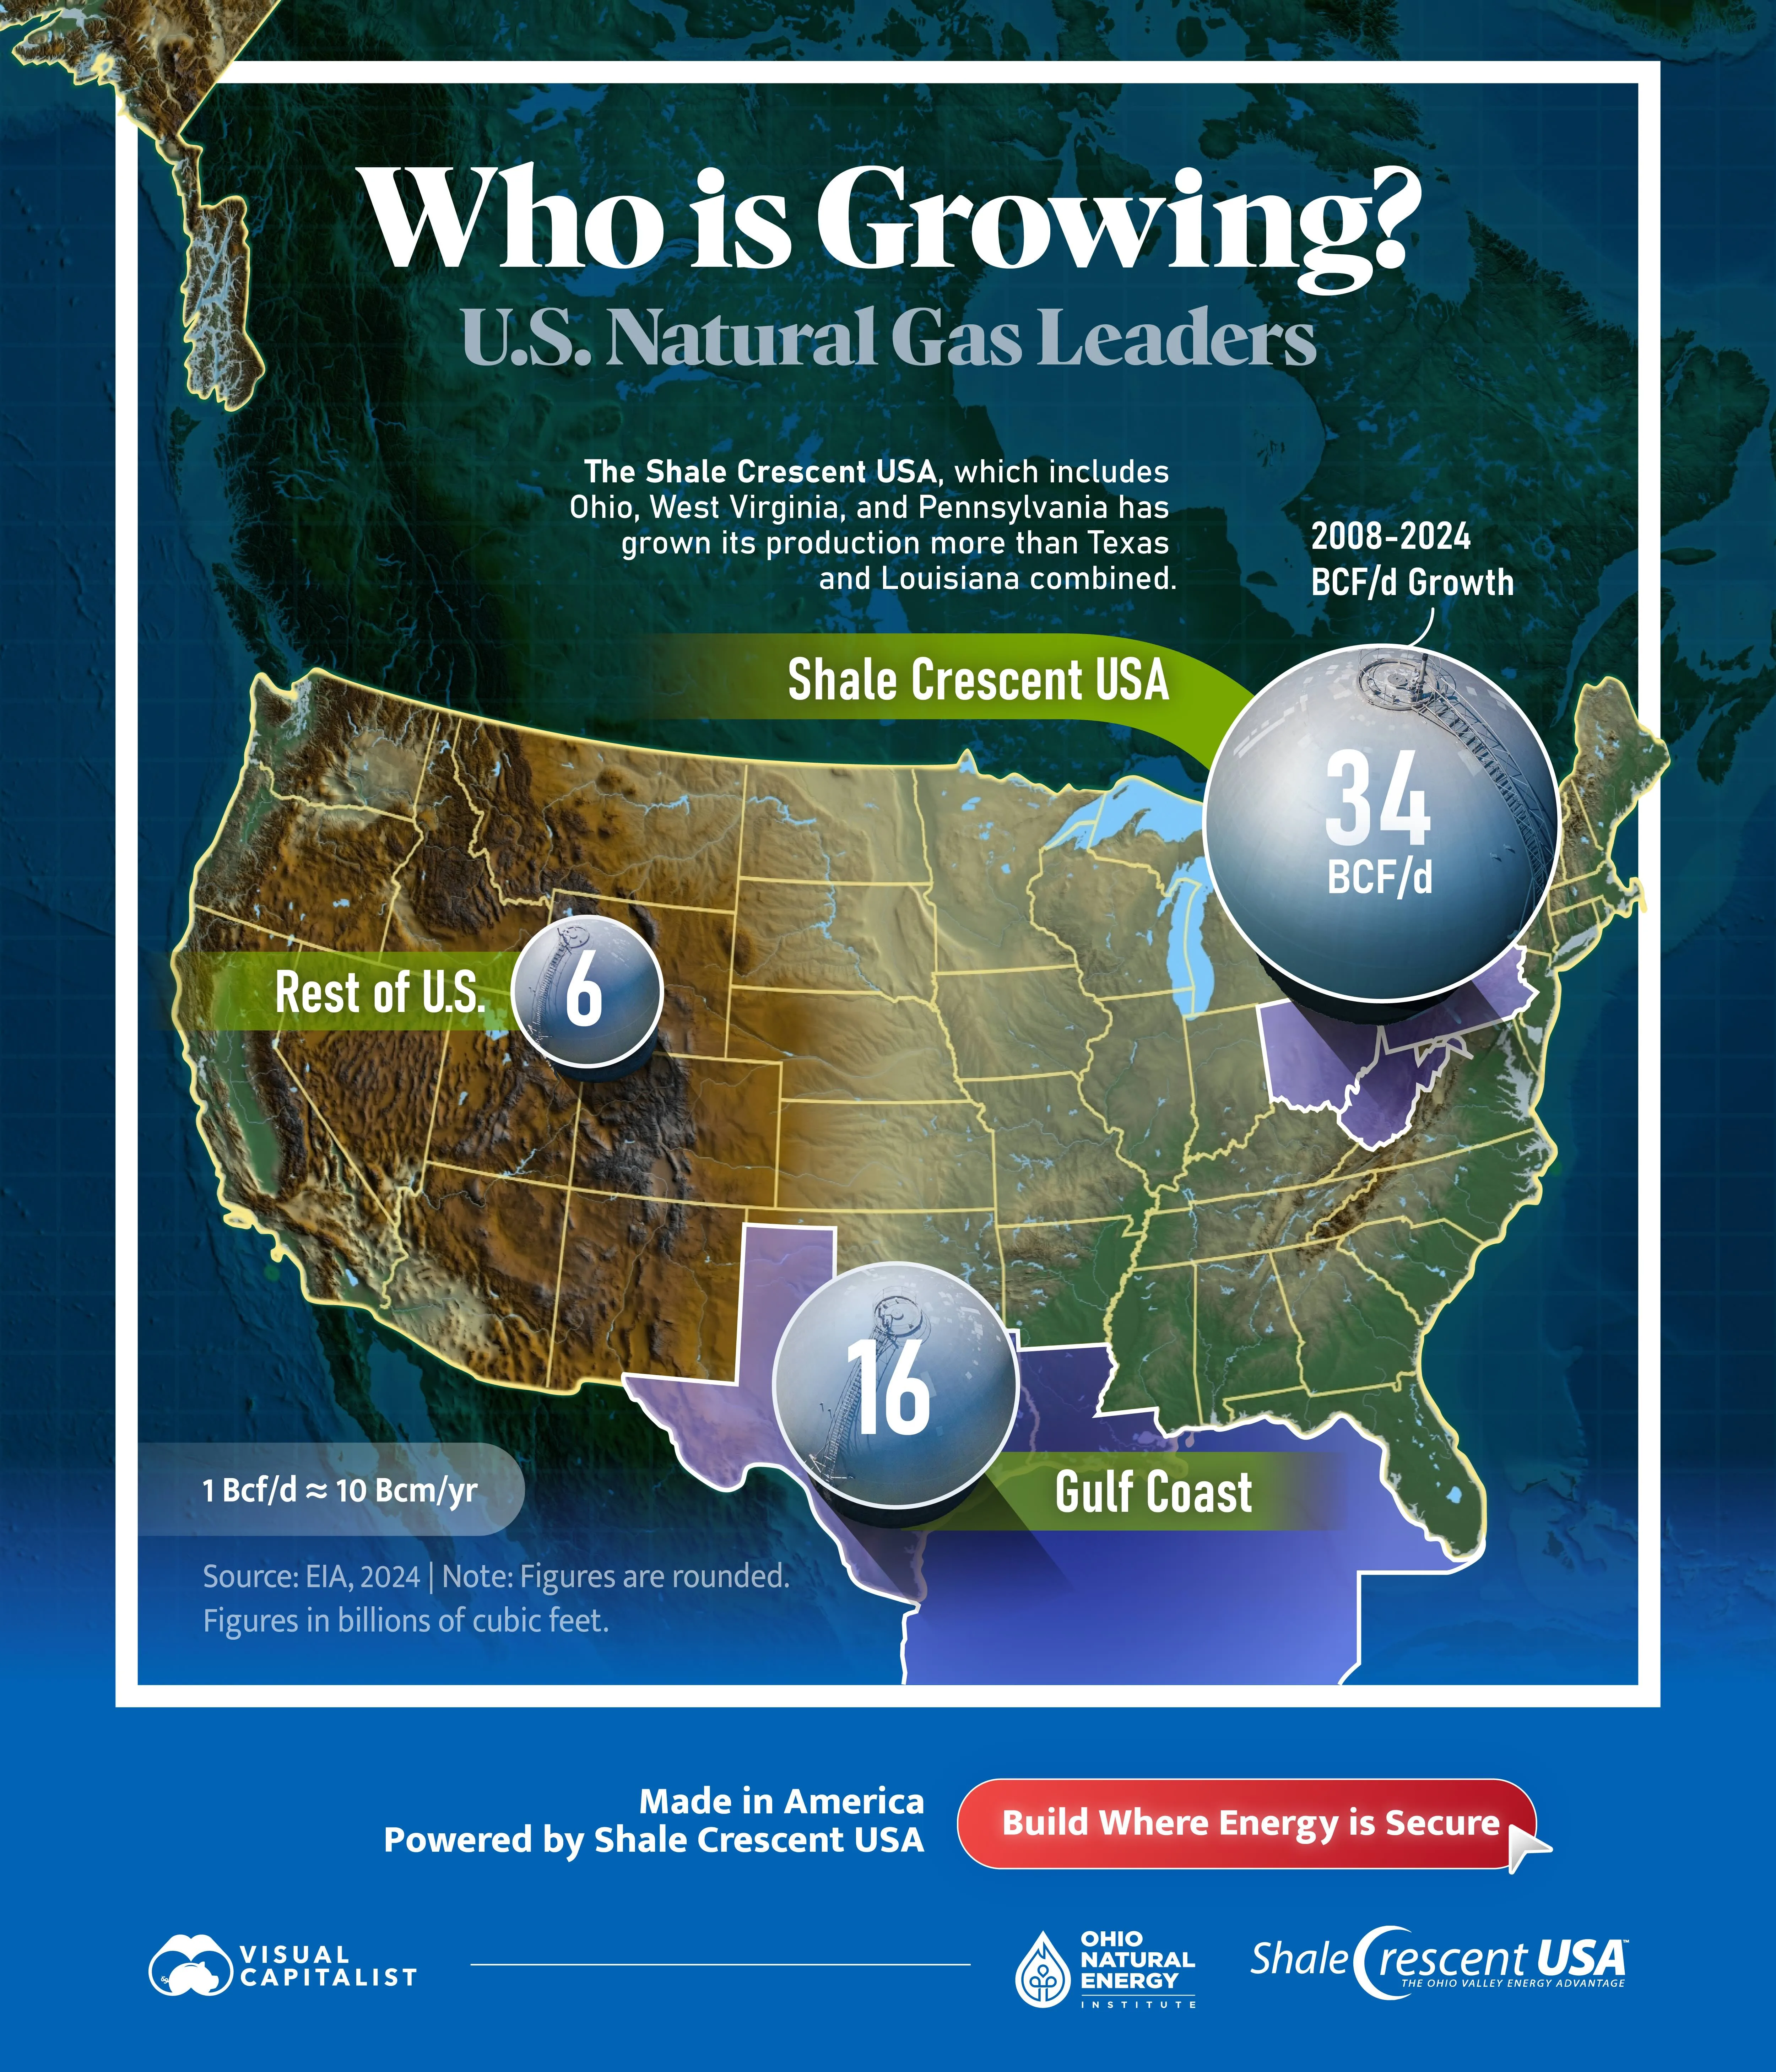
Key Takeaways- Shale Crescent USA leads U.S. natural gas leaders, adding 34 Bcf/d (351 Bcm/yr) since 2008—more than Texas, Louisiana, and the rest of the U.S. combined.
- Natural gas in the Shale Crescent USA has grown more than any other region of the world over the last 20 years.
- Each 1 Bcf/d (~10 Bcm/yr) serves about 5.5 million homes per day, highlighting industrial and consumer impact.
Gas production in different U.S. regions varies over time, but which region has had the highest growth in output in recent years?
This map, created in partnership with Shale Crescent USA, shows where natural gas production growth from 2008 to 2024 is concentrated, using data from the EIA.
Shale Crescent in the Lead
Here is a table showing 2008–2024 growth in Billion Cubic Feet Per Day (Bcf/d) and Billion Cubic Meters Per Year (Bcm/yr) for each region.
Region Growth in Natural Gas 2008 to 2024 (Bcf/d)Growth in Natural Gas 2008 to 2024 (Bcm/yr)|
| Rest of the U.S. | 6 | 62 | | Gulf Coast | 16 | 165 | | Shale Crescent USA | 34 | 351 |
From 2008–2024, Shale Crescent USA (Ohio, West Virginia, Pennsylvania) grew by 34 Bcf/d (351 Bcm/yr), outpacing the Gulf Coast’s 16 Bcf/d (165 Bcm/yr) and the rest of the U.S. at 6 Bcf/d (62 Bcm/yr).
Notably, the Shale Crescent’s growth exceeded Texas, Louisiana, and the rest of the U.S. combined. Additionally, 1 Bcf/d (~10 Bcm/yr) can supply roughly 5.5 million U.S. single-family homes per day, underscoring the scale of this surge.
Why Such Large Growth?
Shale Crescent USA’s remarkable growth stems from technological breakthroughs that unlocked vast energy resources within world-class rock formations. This region was the birthplace of the oil and gas industry more than 150 years ago, and it remains a global leader. No other area on Earth has experienced greater growth over the past two decades.
The Marcellus and Utica shale formations hold one of the largest, most prolific gas endowments in North America, giving gas producers a deep inventory of high-quality drilling locations.
The second key driver is infrastructure and market access. As demand shifted toward gas-fired power—especially in the Northeast—new and expanded pipelines connected Marcellus/Utica volumes to nearby load centers and, increasingly, to the Midwest and Gulf Coast.
Landmark projects such as Shell’s ethane cracker in Pennsylvania, Nucor’s steel plant in West Virginia, and Intel’s semiconductor facility in Ohio, along with a growing number of data centers and other energy-intensive users, are benefiting from this region’s reliable and affordable energy supply. |


