All-In-One Indicator for Exponential Moving Average Crossover Strategy
SUPERALGOS DATA MINING
A beginner trading system to discover trading, indicators and Superalgos

Photo by Markus Spiske on UnsplashEMA crossover trading system is the simplest trading strategy to step in and start a trading activity.
On its own, this trading strategy offers poor return and requires a favorable fees scheme to be profitable. We have already shown ways to improve the return over time by an algorithmic process of systematic compounding but it does not consider optimization on entry and exit point. In this article we will explore the process of creating an all-in-one indicator that will allow to find the safest entry and exit points of the EMA crossover strategy by combining several indicators in a simple parametric equation.
Prior to this article, I strongly advise to read my EMA crossover article for an insight on the basics of Exponential Moving Average and the crossover strategy.
All the data in this article are obtained using the Superalgos Platform backtesting and indicator computing capabilities. Statistical analysis and graph generation have been done using Knime Analytics.
Building the All-In-One EMA Crossover Strategy IndicatorA composition of weighted signalsThe underlying idea of a fully integrated indicator to use the EMA crossover strategy is to build an indicator that will integrate basics and more advanced signals for trading stage opening / exiting and confirmations. When we seek for confirmation of a trading signal, the best practice is to use non-correlated indicators, i.e. using different processing principles or different data sources.
Each indicator will have its own outcome, giving its own trading signal, buy or sell, depending on the market conditions. The combination of the different indicators can then be simply done with an equation summing the signals weighted by factors chosen as a function of the importance we want to give to the respective signals.
Considering we use 5 indicators, 3 trend related indicators and 2 non-correlated, the equation of the all-in-one indicator is described by:
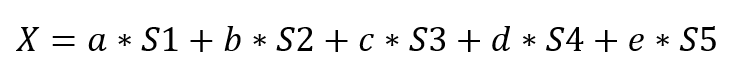
Where S… is the signal given by each indicator as -1 for a sell signal and +1 for a buy signal; a, b, c, d and e are the weighting factors defined as:
A =a + b + c
For the EMA related indicators, and:
B = d + e
For the non-correlated indicators with the condition:
A + B = 1
The weight of each parameter can then be adjusted on a 0 to +1 range; thus, the all-in-one indicator will vary between +1 and -1, generating buying and selling signals respectively for positive and negative crossing.
EMA related indicatorsAmong the multitude of trend indicators, those based on moving averages are the most common. Since the strategy is based on the EMA crossover pattern, we will of course choose the relative position between a short term and long term EMA as the first indicator. Our goal is to have a good overview of how the trend is going to behave, if we will have a strong bullish trend and the potential of the price to explode in the right direction. To that extent we chose to combine the first one with the Trend Intensity indicator and the Mean Break Out.
EMA periods
The calculation procedure for EMA will not be described here. You can find more information about EMA in a previous article.
As already reported the most efficient couple for short term and long term EMA is 13–48. So, this is what we are going to use to identify the relative position.
We will then have +1 for the short EMA above the long EMA, and -1 for the opposite.
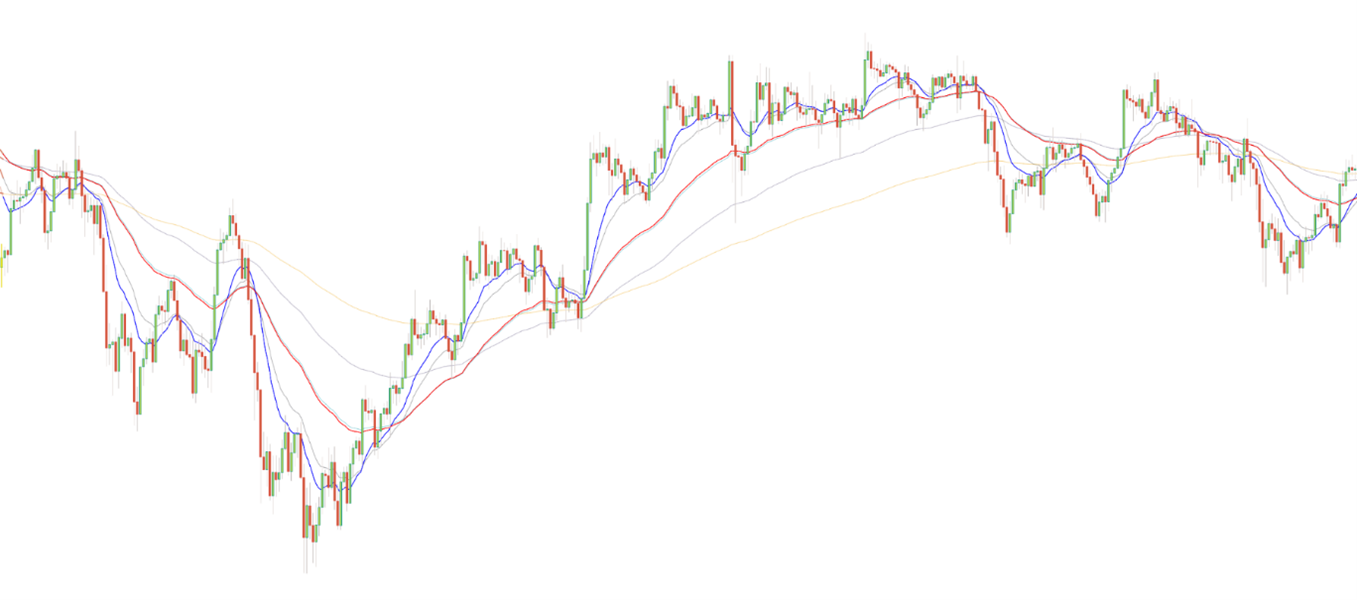
BTC/USDT at 01-hs chart with Exponential Moving Averages using Superalgos and Sparta Data mineTrend Intensity
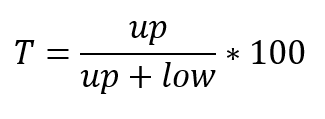
The Trend Intensity indicator is a measure of the accumulation of the number of periods the price is above the EMA against the price is under the EMA. Given a number of periods equal to the number of periods of the EMA it gives an information on the trend strength and if the trend will tend to reverse.
To calculate the trend intensity indicator, we analyse the position of the price against the EMA :
if a candle closes above EMA, we add 1 to the pool “up” of the above candles and 0 if the candle closes belowif a candle closes below the EMA, we add 1 to the pool “low” of the below candles and 0 if the candle closes aboveThe trend intensity is then described by the formula :
BTC/USDT at 01-hs chart with Trend Intensity 13 (green) and 48 (red) periods using Superalgos and WEMA Data mineAn upward trend is spotted if the indicator cross the 50 line in an upward direction, giving a +1 value to the trend intensity component of the all-in-one indicator. -1 is attributed to the trend intensity component when the indicator cross the 50 line in and downward direction, describing a downward trend.
Mean Breakout Signal
The Mean Breakout (MBO) compares the difference between the closing price of a candle and a moving average over N periods to the difference between the min and max value of the closing price over the same N periods. It is described by the formula :
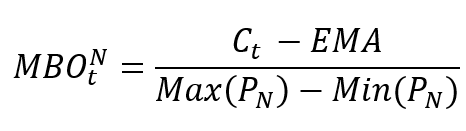
BTC/USDT at 01-hs chart with Mean Breakout indicator over 13, 48, 96 192 and 384 periods using Superalgos and WEMA Data mineThe MBO indicator is centered around 0. A crossing to the positive zone indicates and upward trend and will give a +1 to the MBO component of the all-in-one indicator and a -1 will be attributed at a downward trend signal, MBO crossing to the negative region.
Non-correlated indicatorsThere is also a big diversity for confirmation indicators independent from the different moving averages. When seeking for confirmation traders often rely on momentum indicators. For our study we will use a powerful indicator called the Ratio Momentum. To select the second confirmation indicator we will pick something really original and look toward signal processing inherited indicators, more especially to the Even Better Sine Wave indicator from John Ehlers.
The Ratio Momentum
The Ratio Momentum (RM) is actually no more than the ratio between two RSI calculated at different periods, on long and on short term.
The RSI, Relative Strength Index, is a momentum indicator indicating if an asset is oversold or overbought. In such cases there is a high probability the trend will reverse, going upward after an oversold momentum, and downward in an overbought momentum. It measures the direction and the strength of a movement according to the formula :
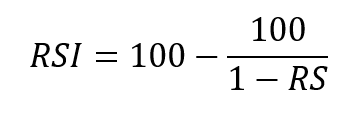
Where RS is the Relative Strength calculated as the ratio of the mean gains to the mean losses over a certain number of periods.
We will then use RM as the ratio between the 13 periods RSI and the 48 periods RSI
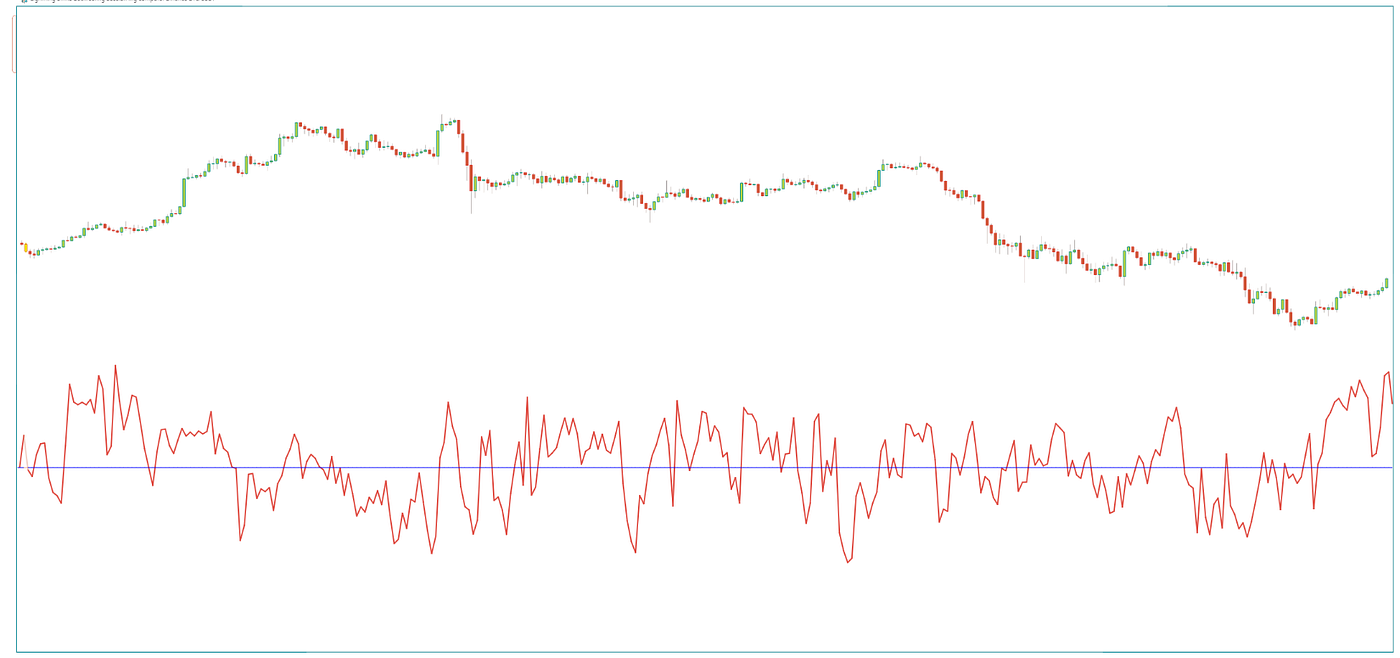
BTC/USDT at 01-hs chart with Ratio Momentum indicator using Superalgos and WEMA Data mineSince it is the ratio of 2 RSI, the Ratio Momentum is centered around 1. An upward trend is spotted when RM is above 1 (13 periods RSI higher than 48 periods RSI), giving a +1 for the Momentum component of the all-in-one indicator and the trend is downward when RM is below 1, -1 is then attributed to the Momentum component.
The Even Better Sine Wave
The Even Better Sine Wave indicator has been created by John Ehlers and is described in his book Cycle Analytics For Traders. It is the ratio of the wave component of the Band Pass Filtered price over the power of the resulting wave of the Band Pass Filtered price. The Band Pass Filter is build by applying a low pass filter to a single pole High Pass Filtered price. It works intensively well in trending market and avoid most of the whipsaws.

BTC/USDT at 01-hs chart with Even Better Sine Wave indicator at 36/6 using Superalgos and Quasar Data mineThe EBSW indicator give an upward trend confirmation when wbove 0.85 and we attribut +1 to its component in the all-in-one indicator. -1 is attributed in all other cases.
The all-in-one indicatorFor this study we chose equilibrated weighting factor, i.e. the two groups of indicator share are at 0.5, each group equally distribute the weight to its members.

BTC/USDT at 01-hs chart with all-in-one indicator using Superalgos and WEMA Data mineThe indicator is plotted with 3 reference lines at -0.5, 0 and +0.5. We observe very interesting potential entry signals when the signal crosses above or below the 0 line and the +/- 0.5 lines seem to give exit signals. A low pass filter is applied to the signal to have a better readability.
Backstesting With the All-In-One IndicatorOur study will be divided in two parts. In a first time we will address and intensive calculation process with Knime Analytics to identify what could be the most promising parameters of a trading system. In a second time we will use Superalgos to paper trade the strategy with the parameters calculated previously.
Extensive parameters study with KnimeWe built a Knime workflow to simulate a perfectly reactive trading system using the all-in-one indicator to find the best entry point, the best exit point and the optimized stop loss level. We also performed a short study of the effect of the fees. The knime workflow is considered to simulate a perfectly reactive trading system since it will simulates instantaneous opening and closing of the positions at the 01-hs chart, like if we used a bot able to react instantly at the signal detection.
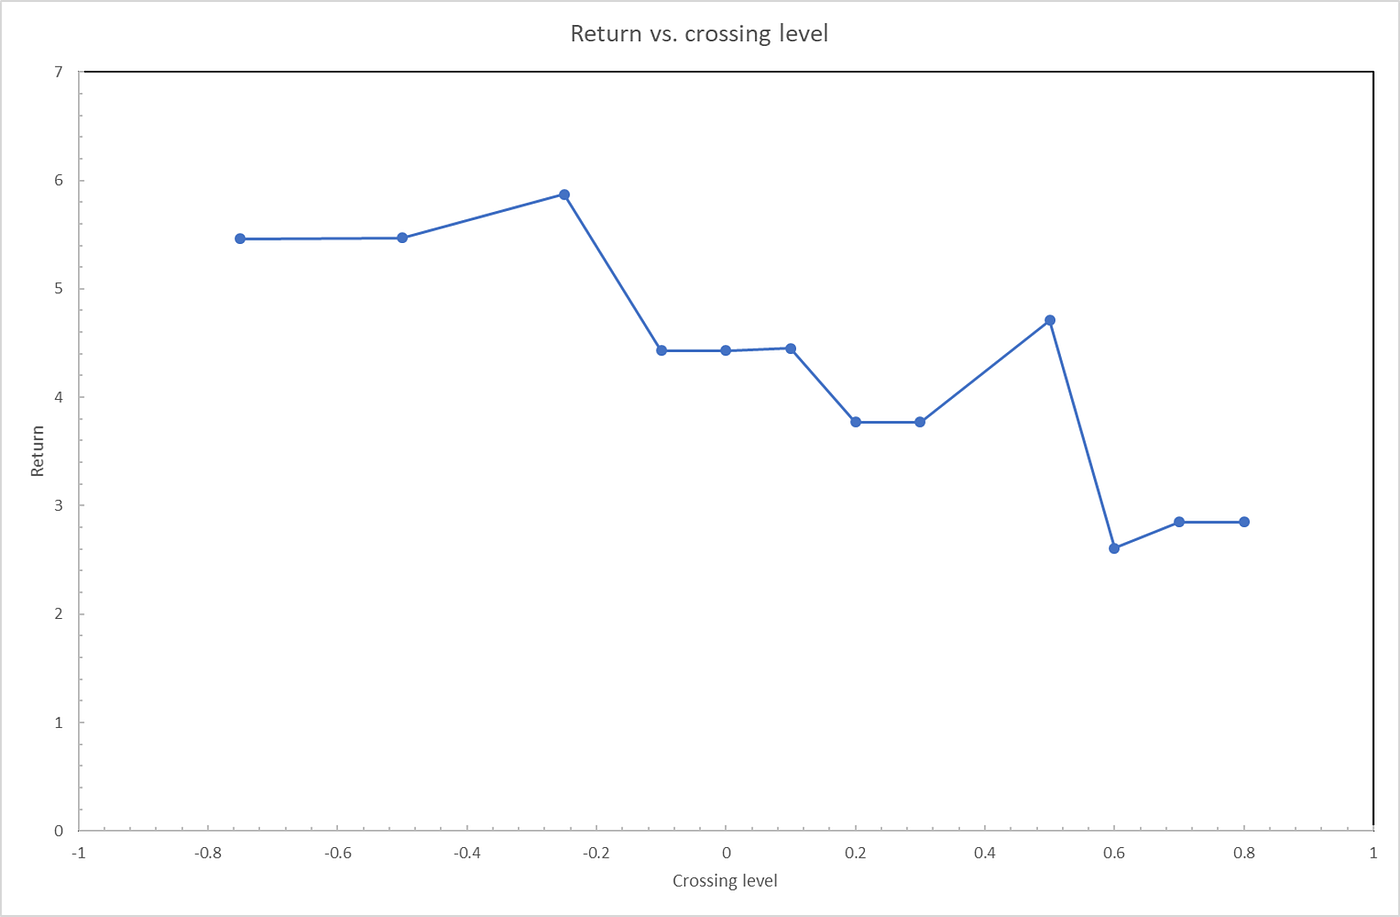
SImulation of the return as a function of the exit level after 1.8 years on BTC/USDT pair at the 01-hs chart (trading fees at 0.075%)The best entry point (data not shown) has been determined at the crossing of the 0 line in the upward direction. The exit point study seems to reveal 2 points of interest at +0.5 and -0.3, giving a return between 5 and 6 (500% and 600%) including symetric fees of 0.075% per trade.
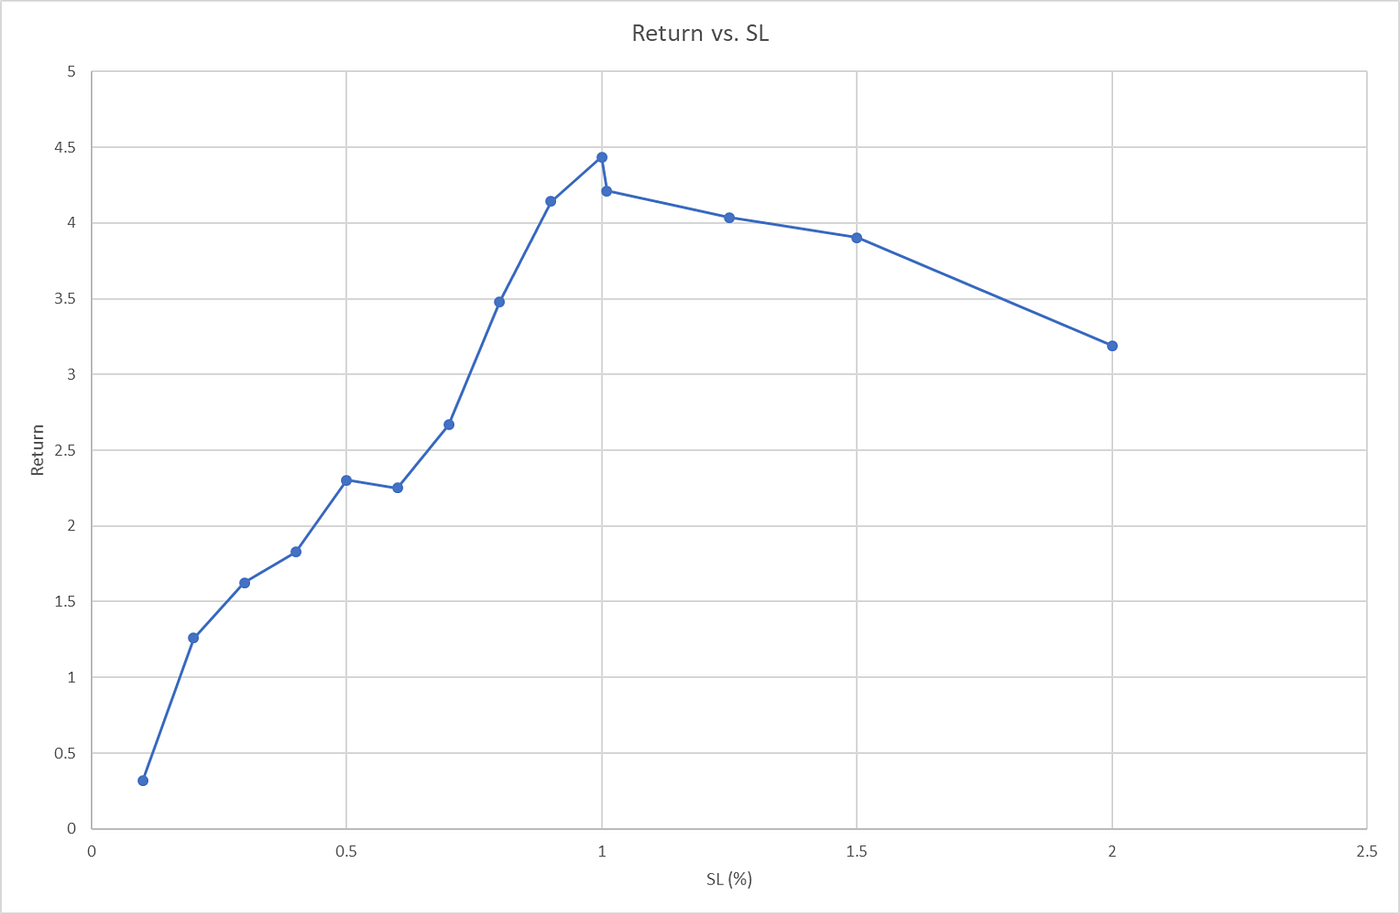
Effect of the stop loss level ont the return (fees at 0.1%)Studying the effet of the stop loss level on the return show an optimum value of 1%.
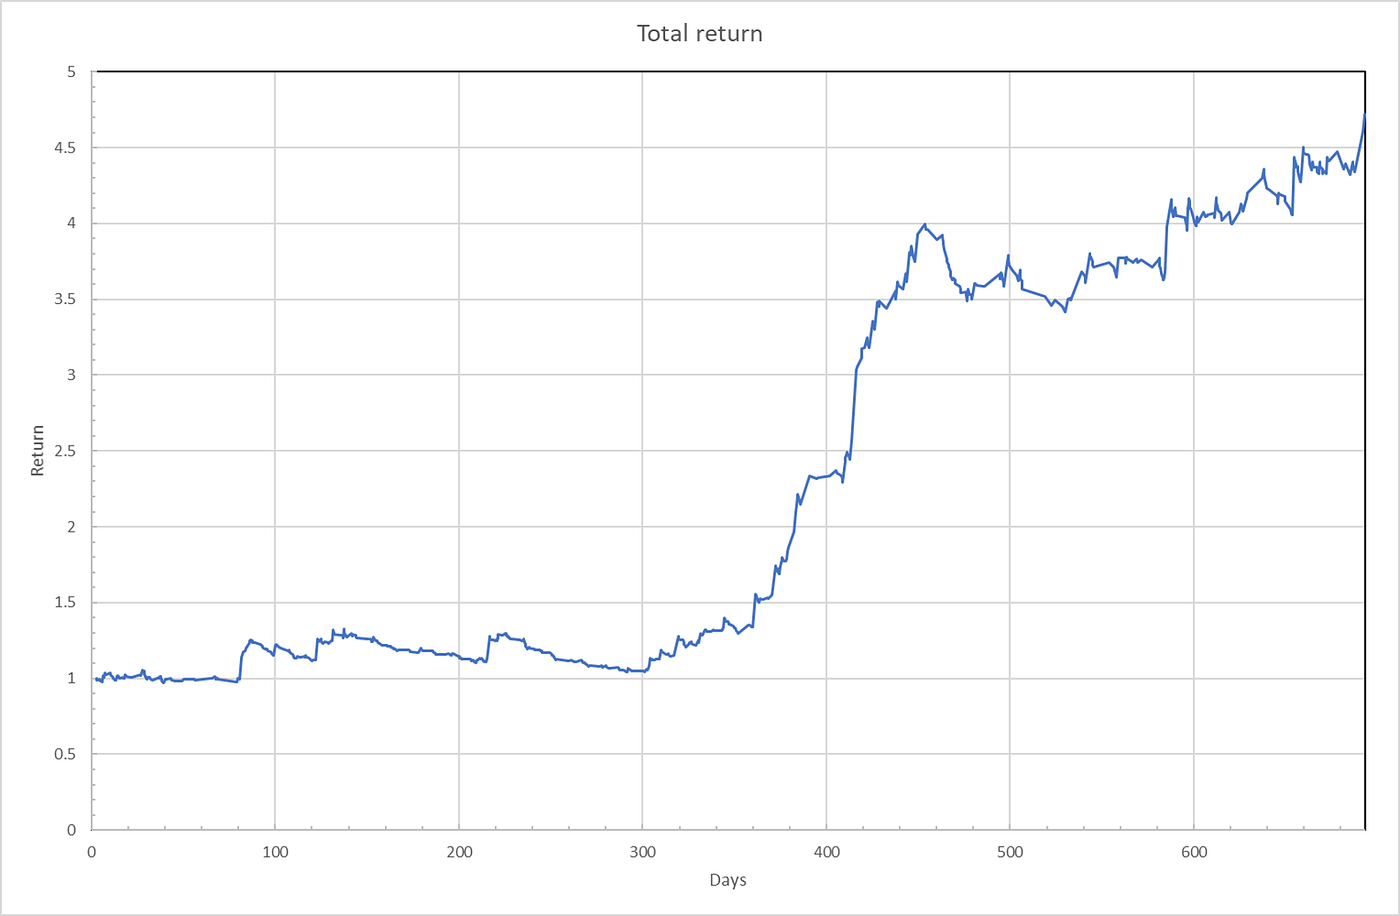
Return over time of the simulated strategy on BTC/USDT pair from 1st of january 2020 to 14th of november 2021 (0.1% fees)If we compile the first results to simulate trading over 1.8 years, we observe a total return about 4.9.
The fees level chosen in this study is quite fair and we could eventualy expect slightly lower fees with fidelity programs or the use of the native token of the trading platforms. If we look at the effect of fees, it shows en exponential decreasing return as the fees level increase.
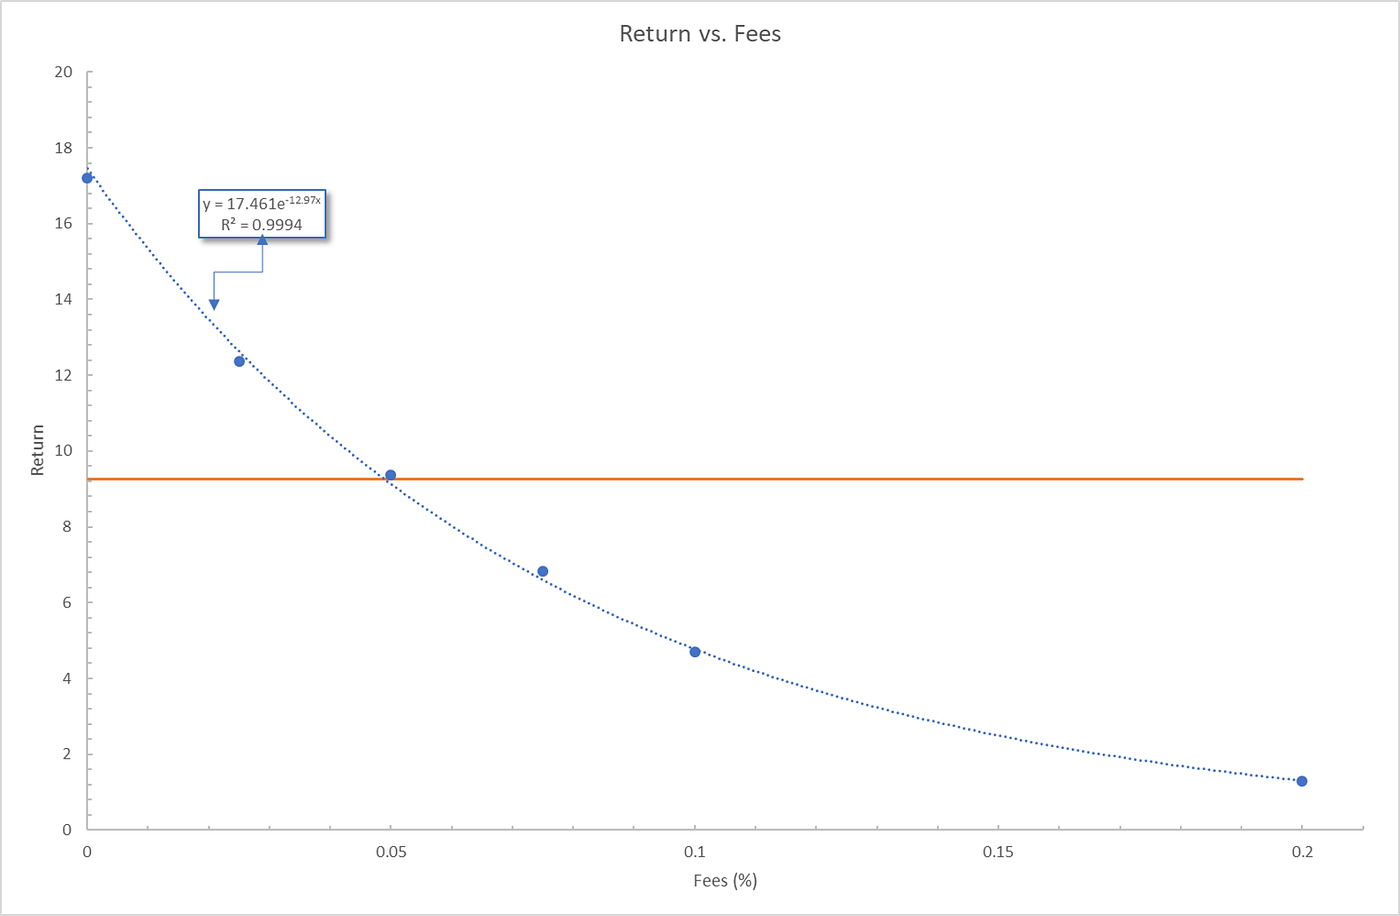
Effect of fees on the total return after 1.8 years simulated tradingThe orange line on the last graph shows what a simple buy and hold of BTC/USDT pair would have achieved on the same periods. Considering everything is optimized, beating this simple strategy would have required fees lower than 0.05% per trade. Actually, the performance is the same as a simple EMA cross strategy on the same period.
Backtesting in SuperalgosA strategy based on the all-in-one indicator has been implemented in Superalgos. We use the EMA13/EMA48 crossover and crossunder as trigger ON and OFF. Once the stage is opened the bot will fire a set of 20 market buy orders, each market order will be placed when all-in-one indicator will be higher than or equal to 0.5. Once all the orders will be placed, and if the strategy is not triggered off, 20 market sell orders will be fired and each order will be place as soon as the indicator is inferior to 0.5. Stop loss is set at 1% of the balance, and the whole balance will be used each time. We eventually placed take profit at 17% of the total balance.
Backtest has been performed at the 01-hs time frame over 1.8 years from 1st of january 2020, using the candle close rate, i.e. the orders will be placed at the close point of the candle next to the candle the conditions will be met. This is actually a huge difference with the perfectly timed system simulated with Knime and we expect lower performances. This is actually the reason we chose to give a little advantage to the backtested strategy with multiple orders firing. It will average the global order rate and hopefuly dampen the effect of the order timing as compared to the simulation.

Backtest at 01-hs time frame for BTC/USDT pairThe results show a profitable strategy. We achieved a 2.631 return with a 53% hit rate. As expected we are a bit lower than the ideal execution of the last simulations. This is of course less than what a buy & hold position would have achieved on BTC but it proves to be a good trading system for educational purposes.
A more realistic test could have been achieved using the Paper Trading option but would have requiered to wait for several months to have significant results using the 01-min time frame to scan the indicators calculated at the 01-hs time scale.
ConclusionWe have shown we can build an indicator to integrate 5 different signals in order to execute the EMA crossover strategy with confirmations. The simulation and backtest show modest but profitable results and the trading system is a good candidate for educational activities on trading and indicator/strategy building in Superalgos |


