SI
SI
discoversearch

We've detected that you're using an ad content blocking browser plug-in or feature. Ads provide a critical source of revenue to the continued operation of Silicon Investor.  We ask that you disable ad blocking while on Silicon Investor in the best interests of our community.  If you are not using an ad blocker but are still receiving this message, make sure your browser's tracking protection is set to the 'standard' level.
Strategies & Market Trends : Buy and Sell Signals, and Other Market Perspectives
SPY 681.89+0.3%Oct 31 5:00 PM EST

 Public ReplyPrvt ReplyMark as Last ReadFilePrevious 10Next 10PreviousNext  
To: GROUND ZERO™ who wrote (92991)5/26/2017 12:26:55 AM
From: John Pitera  Read Replies (2) of 218280
 
Hi GZ,

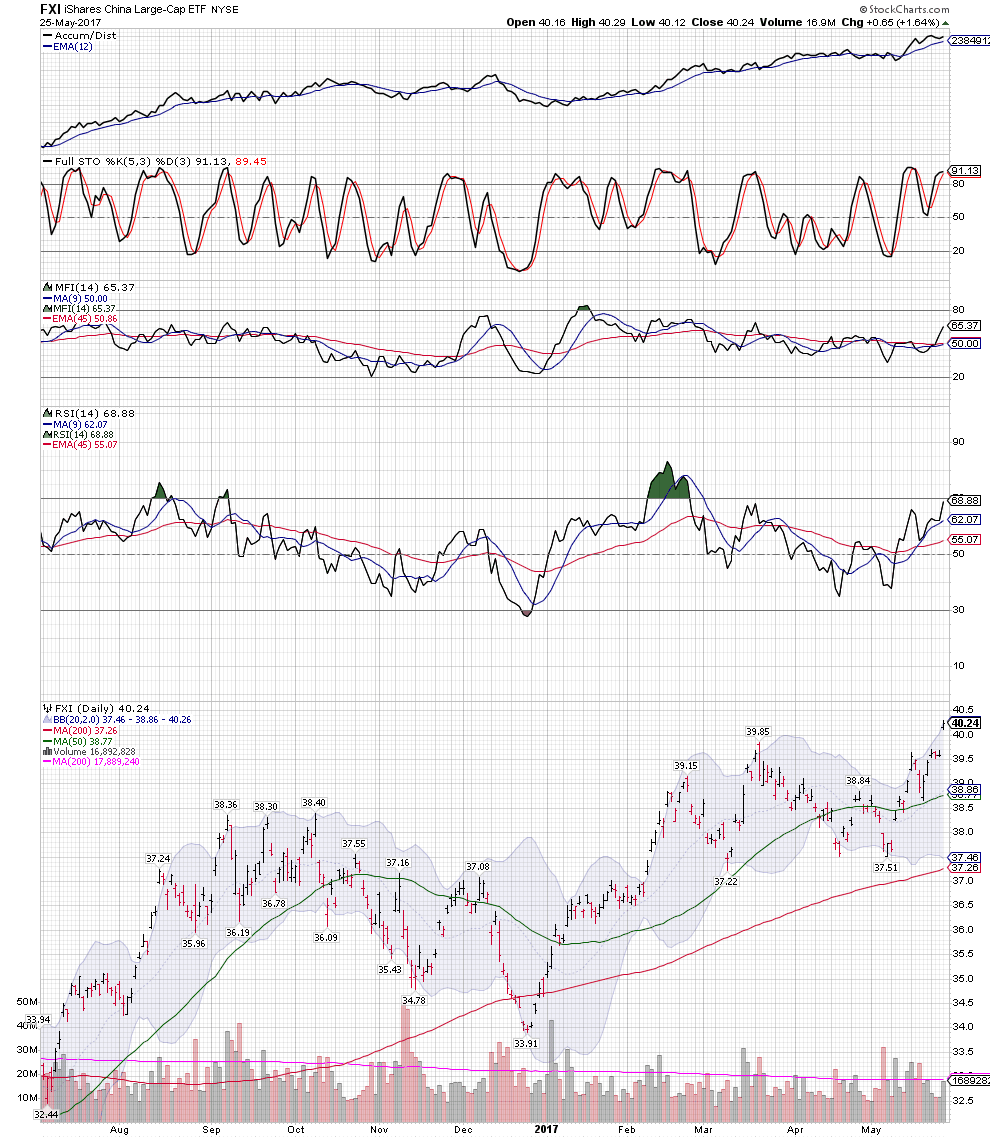
You have got a nice tight stop with room for FXI to fill the gap and still keep you in the position.

The daily chart looks good

FXI has made a new yearly high, the accumulation/distribution chart is rising and looks good as is the Money Flow indicator... Money going into the stock on upticks. The RSI moving average crossover system is in buy mode and there are no divergences... all of that is great, and the price was above the upper Bollinger Band today as it was a few days ago... so we should see higher highs where the price is not above the upper BB which would show momentum deteriorating......... that has not happened....


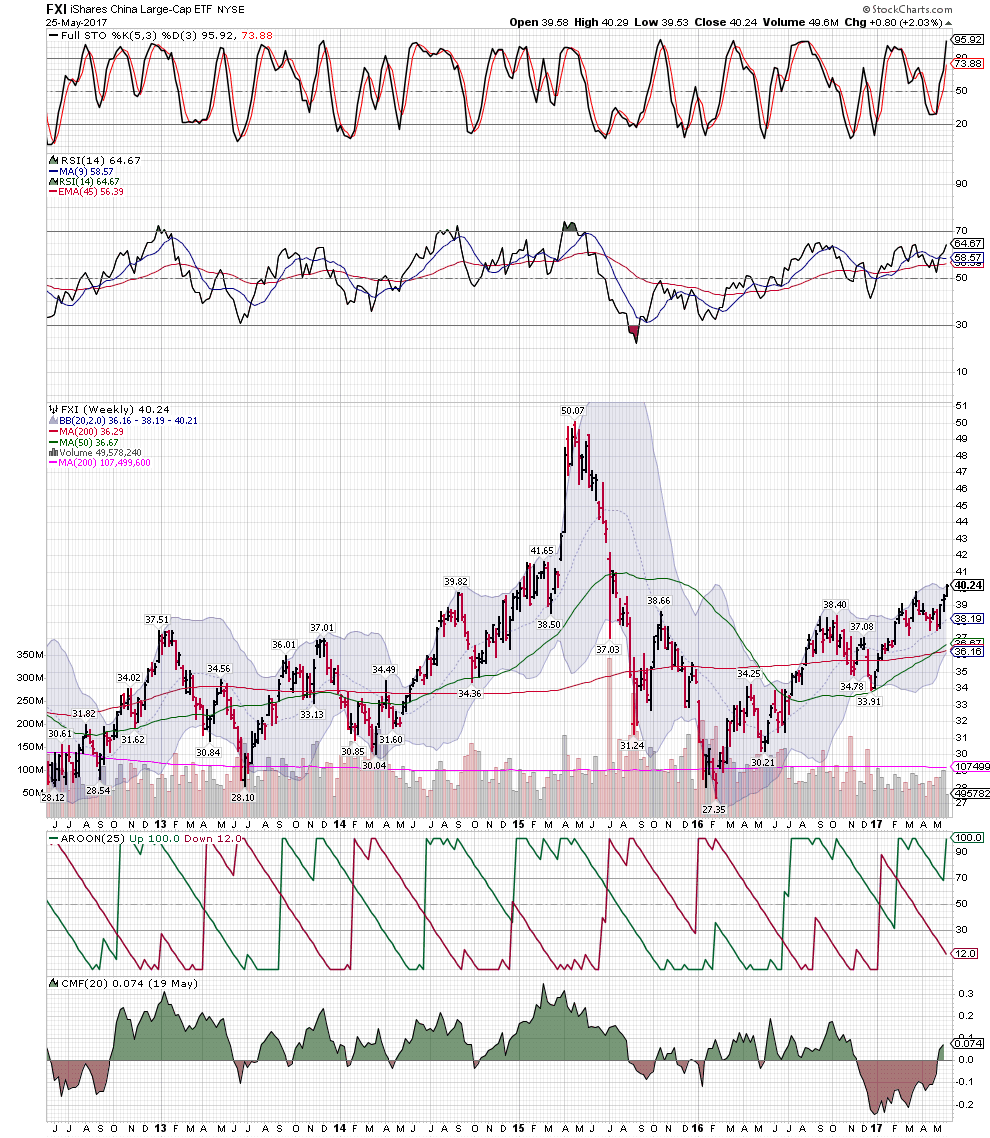
The Weekly chart of FXI:

Price is above upper BB band: good

Aroon indicator is bullish

the Chalkin Money Flow has just turned positive. -- good

RSI MA crossover system is on a buy and the RSI has lots of room to run , no divergences -- very good.


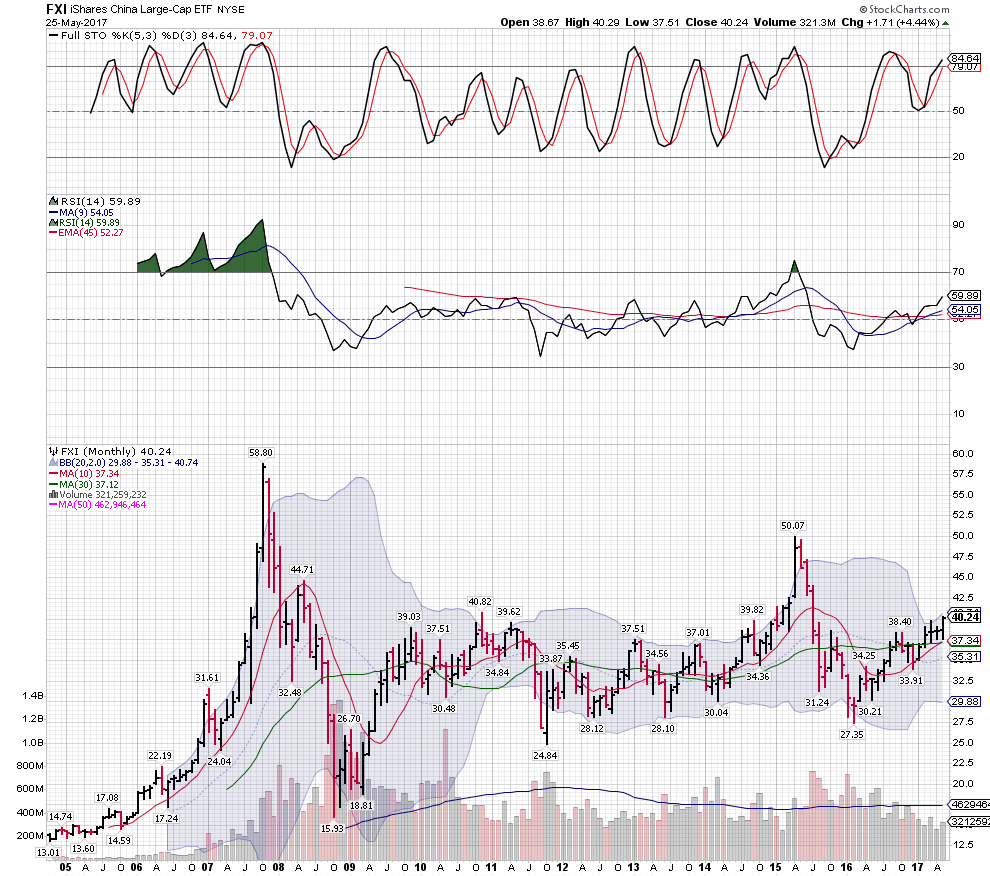
The Monthly FXI chart

There is some overhead from the highs of 2016 and 2007.... but that was quite a while ago, the volume is a little on the light side....


So Technically the charts are pretty darn good bordering on great. Now this is a China stock ETF and so we have to remember that the Chinese crackdown on the shadow banking system has been depressing some Chinese assets and the yield curve was inverted a bit last week with the 3 year bonds being higher than the 5 year bond.

Moody's did downgrade China the nations credit rating a couple of notches the other day... but there is always palace intrigue when it comes to China and the unique way that they run their unique brand of State Communist / Capitalism.......

but the stock is going up on bad news so you have a textbook good logical reason to be long and a very well chosen stop.....

You are all aces my friend...... solid thinking as I see it. It is starting to feel like 1998 -1999 isn't it.....

but it may feel even more like the spring of 1997 or the spring of 2004 and very bullish things happened to the Equity markets on the last 2 Magical Mystery Tours.....


youtube.com

----------------------

Moody's downgrades China over debt worries
May 24, 2017 2:03 AM ET|By: Yoel Minkoff, SA News Editor

China's great wall of debt! Moody's has lowered the nation's credit rating to A1 from Aa3, with a stable outlook, citing Beijing's waning financial strength and rising liabilities.

It marks the first time a major ratings agency has downgraded the country in more than 25 years.

The move received a backlash from China's finance ministry, which said the decision was "absolutely groundless" and was based on an "inappropriate method."

Shanghai -0.8% to 3,037.

----------------------------------

JJP
Report TOU ViolationShare This Post
 Public ReplyPrvt ReplyMark as Last ReadFilePrevious 10Next 10PreviousNext