Daily Presidential Tracking Poll
Monday, August 22, 2011
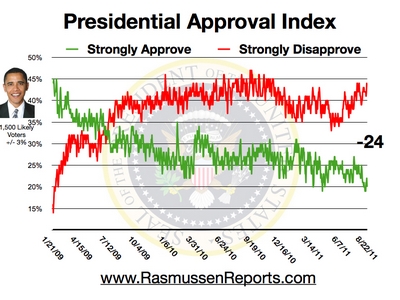
Poll for Monday shows that 20% of the nation's voters Strongly Approve of the way that Barack Obama is performing his role as president. Forty-four percent (44%) Strongly Disapprove, giving Obama a Presidential Approval Index rating of -24 ( see trends).
That matches the lowest Approval Index rating yet recorded for President Obama, a level previously reached just once last September. By way of comparison, President Bush had ratings near the end of his second term in the minus 30s. For President Obama, 42% of Democrats Strongly Approve while 79% of Republicans Strongly Disapprove. Among those not affiliated with either major party, 13% Strongly Approve and 44% Strongly Disapprove.
If you missed yesterday’s edition of the Rasmussen Report on radio, LISTEN HERE. Scott Rasmussen will be back on the air next Sunday at 3:06 Eastern on WLS 890 AM in Chicago, WMAL 630 AM in Washington, and online everywhere.
During yesterday’s show, Scott discussed polls on Election 2012, the race for the GOP nomination, the impact of the Tea Party, the ideological make-up of the nation, and more.
The Presidential Approval Index is calculated by subtracting the number who Strongly Disapprove from the number who Strongly Approve. It is updated daily at 9:30 a.m. Eastern (sign up for free daily e-mail update). Updates are also available on Twitter and Facebook.
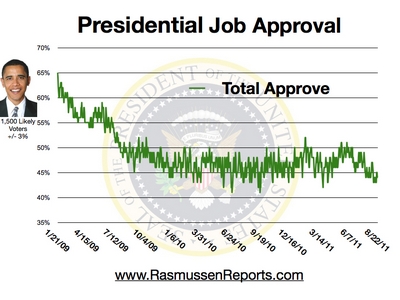
Overall, 44% of voters say they at least somewhat approve of the president's performance. Fifty-five percent (55%) at least somewhat disapprove.
Most voters nationwide continue to favor repeal of the health care law passed last year.
(More Below)
The Wall Street Journal has called Scott “America’s leading insurgent pollster” and the Washington Post says he is a “driving force in American politics.” In a book released last year, Scott observed that "the gap between Americans who want to govern themselves and politicians who want to rule over them may be as big today as the gap between the colonies and England during the 18th century." He added that "the American people don't want to be governed from the left, the right, or the center. They want to govern themselves." In Search of Self-Governance is available at Amazon.com.
If you’d like Scott to speak to your organization, meeting, or conference, please contact Premiere Speakers. You can also follow Scott on Facebook.
MAD AS HELL: How the Tea Party Movement is Fundamentally Remaking Our Two-Party System, by Scott Rasmussen and Doug Schoen, can be ordered at Amazon.com, Barnes and Noble, and other outlets. It's also available in bookstores everywhere.
It is important to remember that the Rasmussen Reports job approval ratings are based upon a sample of likely voters. Some other firms base their approval ratings on samples of all adults. Obama's numbers are always several points higher in a poll of adults rather than likely voters. That's because some of the president's most enthusiastic supporters, such as young adults, are less likely to turn out to vote. It is also important to check the details of question wording when comparing approval ratings from different firms.
(More Below)
Rasmussen Reports has been a pioneer in the use of automated telephone polling techniques, but many other firms still utilize their own operator-assisted technology ( see methodology). Pollsters for Presidents Jimmy Carter and Bill Clinton have cited our " unchallenged record for both integrity and accuracy."
The Pew Center noted that Rasmussen Reports beat traditional media in covering Scott Brown's upset win in Massachusetts earlier this year: "It was polling-not journalistic reporting-that caught the wave in the race to succeed Massachusetts Senator Edward M. Kennedy." Rasmussen Reports was also the first to show Joe Sestak catching Arlen Specter in the Pennsylvania Democratic Primary race last year.
Once again in 2010, Rasmussen Reports polling provided an accurate preview of Election Night outcomes. See how we did.
Larry Sabato, director of the Center for Politics at the University of Virginia, noted, “This was one tough election to poll and forecast. Rasmussen Reports caught the major trends of the election year nationally and in most states.”
In December 2009, a full 11 months before Election Day. A Democratic strategist concluded that if the Rasmussen Reports Generic Congressional Ballot data was accurate, Republicans would gain 62 seats in the House during the 2010 elections. Other polls at the time suggested the Democrats would retain a comfortable majority. The Republicans gained 63 seats in the 2010 elections.
Rasmussen’s final 2010 projections were published in the Wall Street Journal. Scott Rasmussen noted that “it would be wise for all Republicans to remember that their team didn't win, the other team lost. Heading into 2012, voters will remain ready to vote against the party in power unless they are given a reason not to do so.”
In the 2009 New Jersey Governor's race, automated polls tended to be more accurate than operator-assisted polling techniques. On reviewing the state polling results from 2009, Mickey Kaus offered this assessment, "If you have a choice between Rasmussen and, say, the prestigious N.Y. Times, go with Rasmussen!"
In 2008, Obama won 53%-46% and our final poll showed Obama winning 52% to 46%. While we were pleased with the final result, Rasmussen Reports was especially pleased with the stability of our results. On every single day for the last six weeks of the campaign, our daily tracking showed Obama with a stable and solid lead attracting more than 50% of the vote.
We also have provided a summary of our 2008 state-by-state presidential results for your review.
In 2004 George W. Bush received 50.7% of the vote while John Kerry earned 48.3%. Rasmussen Reports polling projected that Bush would win 50.2% to 48.5%. We were the only firm to project both candidates' totals within half a percentage point by (see our 2004 results).
See also our 2008 state results for Senate and governor.
See 2006 results for Senate and Governor.
Daily tracking results are collected via telephone surveys of 500 likely voters per night and reported on a three-day rolling average basis. To reach those who have abandoned traditional landline telephones, Rasmussen Reports uses an online survey tool to interview randomly selected participants from a demographically diverse panel. The margin of sampling error for the full sample of 1,500 Likely Voters is +/- 3 percentage points with a 95% level of confidence. Results are also compiled on a full-week basis and crosstabs for full-week results are available for Platinum Members.
Like all polling firms, Rasmussen Reports weights its data to reflect the population at large ( see methodology). Among other targets, Rasmussen Reports weights data by political party affiliation using a dynamic weighting process. While partisan affiliation is generally quite stable over time, there are a fair number of people who waver between allegiance to a particular party or independent status. Our baseline targets are established based upon separate survey interviews with a sample of adults nationwide completed during the preceding three months (a total of 45,000 interviews) and targets are updated monthly. Currently, the baseline targets for the adult population are 34.9% Republicans, 34.1% Democrats, and 31.0% unaffiliated. Likely voter samples typically show a slightly larger advantage for the Republicans. |


