This paper cuts by 50% the possible Contribution of CO2 to current observed global warming.
That would reduce by 50% the possible speculated rise due increased CO2. Emergent phenomena I believe also reduces CO2 speculated contributions. I also believe TSI variations also reduces speculated CO2 contributions.
New 80-Year Deep-Ocean Temperature Dataset Compared to a 1D Climate Model January 15th, 2020
The increasing global ocean heat content (OHC) is often pointed to as the most quantitative way to monitor long-term changes in the global energy balance, which is believed to have been altered by anthropogenic greenhouse gas emissions. The challenge is that long-term temperature changes in the ocean below the top hundred meters or so become exceedingly small and difficult to measure. The newer network of Argo floats since the early 2000s has improved global coverage dramatically.
A new Cheng et al. (2020) paper describing record warm ocean temperatures in 2019 has been discussed by Willis Eschenbach who correctly reminds us that such “record setting” changes in the 0-2000 m ocean heat content (reported in Zettajoules, which is 10^^21 Joules) amount to exceedingly small temperature changes. I calculate from their data that 2019 was only 0.004 0.009 deg. C warmer than 2018.
Over the years I have frequently pointed out that the global energy imbalance (less than 1 W/m2) corresponding to such small rates of warming is much smaller than the accuracy with which we know the natural energy flows (1 part in 300 or so), which means Mother Nature could be responsible for the warming and we wouldn’t even know it.
The Cheng (2017) dataset of 0-2000m ocean heat content changes extends the OHC record back to 1940 (with little global coverage) and now up through 2019. The methodology of that dataset uses optimum interpolation techniques to intelligently extend the geographic coverage of limited data. I’m not going to critique that methodology here, and I agree with those who argue creating data where it does not exist is not the same as having real data. Instead I want to answer the question:
If we take the 1940-2019 global OHC data (as well as observed sea surface temperature data) at face value, and assume all of the warming trend was human-caused, what does it imply regarding equilibrium climate sensitivity (ECS)?
Let’s assume ALL of the warming of the deep oceans since 1940 has been human-caused, and that the Cheng dataset accurately captures that. Furthermore, let’s assume that the HadSST sea surface temperature dataset covering the same period of time is also accurate, and that the RCP radiative forcing scenario used by the CMIP5 climate models also represents reality.
I updated my 1D model of ocean temperature with the Cheng data so that I could match its warming trend over the 80-year period 1940-2019. That model also includes El Nino and La Nina (ENSO) variability to capture year-to-year temperature changes. The resulting fit I get with an assumed equilibrium climate sensitivity of 1.85 deg. C is shown in the following figure.
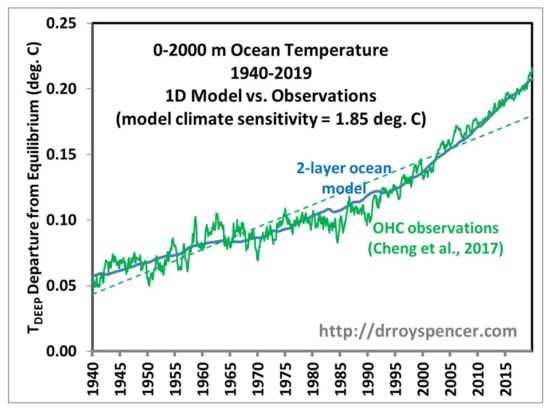 Fig. 1. Deep-ocean temperature variations 1940-2019 explained with a 2-layer energy budget model forced with RCP6 radiative forcing scenario and a model climate sensitivity of 1.85 deg. C. The model also matches the 1940-2019 and 1979-2019 observed sea surface temperature trends to about 0.01 C/decade. If ENSO effects are not included in the model, the ECS is reduced to 1.7 deg. C. Thus, based upon basic energy budget considerations in a 2-layer ocean model, we can explain the IPCC-sanctioned global temperature datasets with a climate sensitivity of only 1.85 deg. C. And even that assumes that ALL of the warming is due to humans which, as I mentioned before, is not known since the global energy imbalance involved is much smaller than the accuracy with which we know natural energy flows. Fig. 1. Deep-ocean temperature variations 1940-2019 explained with a 2-layer energy budget model forced with RCP6 radiative forcing scenario and a model climate sensitivity of 1.85 deg. C. The model also matches the 1940-2019 and 1979-2019 observed sea surface temperature trends to about 0.01 C/decade. If ENSO effects are not included in the model, the ECS is reduced to 1.7 deg. C. Thus, based upon basic energy budget considerations in a 2-layer ocean model, we can explain the IPCC-sanctioned global temperature datasets with a climate sensitivity of only 1.85 deg. C. And even that assumes that ALL of the warming is due to humans which, as I mentioned before, is not known since the global energy imbalance involved is much smaller than the accuracy with which we know natural energy flows.
If I turn off the ENSO forcing I have in the model, then after readjusting the model free parameters to once again match the observed temperature trends, I get about 1.7 deg. C climate ECS. In that case, there are only 3 model adjustable parameters (ECS, the ocean top layer thickness [18 m], and the assumed rate or energy exchange between the top layer and the rest of the 0-2000m layer, [2.1 W/m2 per deg C difference in layer temperatures away from energy equilibrium]). Otherwise, there are 7 model adjustable parameters in the model with ENSO effects turned on.
For those who claim my model is akin to John von Neumann’s famous claim that with 5 variables he can fit an elephant and make its trunk wiggle, I should point out that none of the model’s adjustable parameters (mostly scaling factors) vary in time. They apply equally to each monthly time step from 1765 through 2019. The long-term behavior of the model in terms of trends is mainly governed by (1) the assumed radiative forcing history (RCP6), (2) the assumed rate of heat storage (or extraction) in the deep ocean as the surface warms (or cools), and (3) the assumed climate sensitivity, all within an energy budget model with physical units.
My conclusion is that the observed trends in both surface and deep-layer temperature in the global oceans correspond to low climate sensitivity, only about 50% of what IPCC climate models produce. This is the same conclusion as Lewis & Curry made using similar energy budget considerations, but applied to two different averaging periods about 100 years apart rather than (as I have done) in a time-dependent forcing-feedback model.
Posted in Blog Article | 236 Comments »
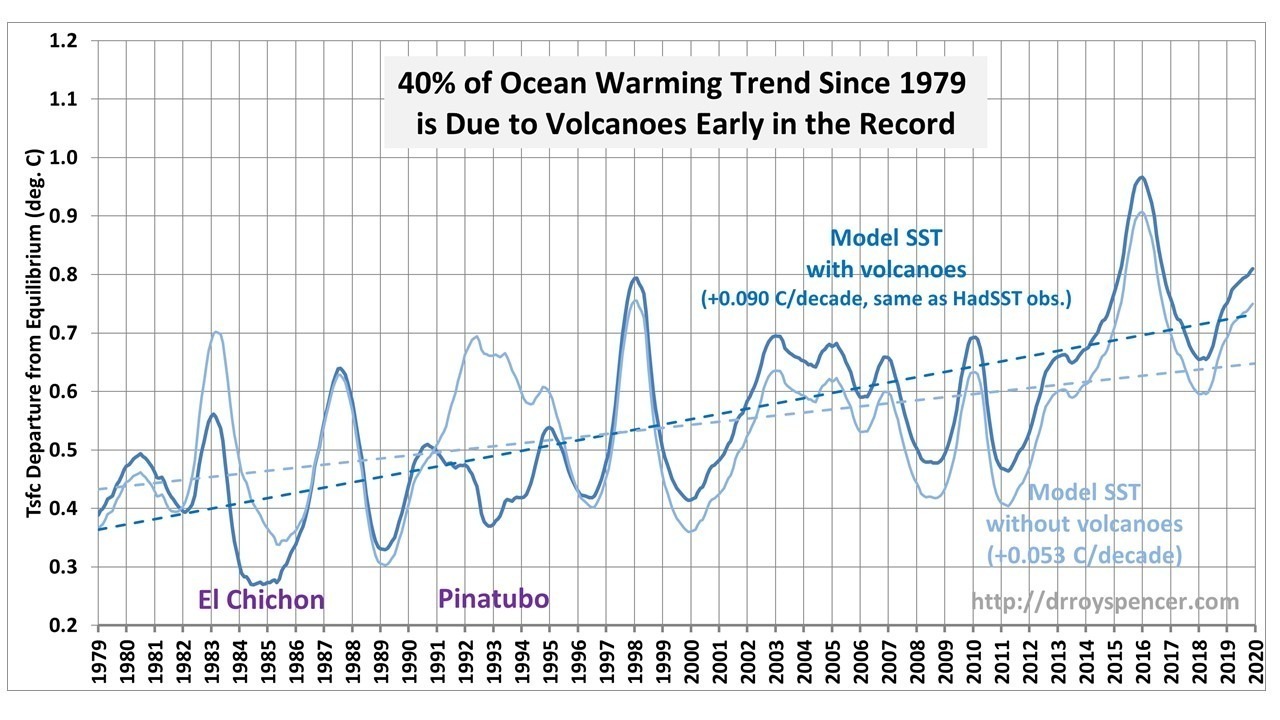
1D Model of Global SST Shows 40% of Warming Since 1979 Due to Early Volcanic Cooling January 14th, 2020
In 2017, Christy & McNider published a study where they estimated and removed the volcanic effects from our UAH lower tropospheric (LT) temperature record, finding that 38% of the post-1979 warming trend was due to volcanic cooling early in the record.
Yesterday in my blog post I showed results from a 1D 2-layer forcing-feedback ocean model of global-average SSTs and deep-ocean temperature variations up through 2019. The model is forced with (1) the RCP6 radiative forcings scenario (mostly increasing anthropogenic greenhouse gases and aerosols and volcanoes) and (2) the observed history of El Nino and La Nina activity as expressed in the Multivariate ENSO Index (MEI) dataset. The model was optimized with adjustable parameters, with two of the requirements being model agreement with the HadSST global temperature trend during 1979-2019, and with deep-ocean (0-2000m) warming since 1990.
Since the period since 1979 is of such interest, I re-ran the model with the RCP6 volcanic aerosol forcing estimates removed. The results are shown in Fig. 1.
 Fig. 1. 1D model simulation of global (60N-60S) average sea surface temperature departures from assumed energy equilibrium (in 1765), with and without the RCP6 volcanic radiative forcings included. The results show that 41% of the ocean warming in the model was simply due to the two major volcanoes early in the record. This is in good agreement with the 38% estimate from the Christy & McNider study. Fig. 1. 1D model simulation of global (60N-60S) average sea surface temperature departures from assumed energy equilibrium (in 1765), with and without the RCP6 volcanic radiative forcings included. The results show that 41% of the ocean warming in the model was simply due to the two major volcanoes early in the record. This is in good agreement with the 38% estimate from the Christy & McNider study.
It is interesting to see the “true” warming effects of the 1982-83 and 1991-1993 El Nino episodes, which were masked by the eruptions. The peak model temperatures in those events were only 0.1 C below the record-setting 1997-98 El Nino, and 0.2 C below the 2015-16 El Nino.
This is not a new issue, of course, as Christy & McNider also published a similar analysis in Nature in 1994.
These volcanic effects on the post-1979 warming trend should always be kept in mind when discussing the post-1979 temperature trends.
NOTE: In a previous version of this post I suggested that the Christy & McNider (1994) paper had been scrubbed from Google. It turns out that Google could not find it if the authors’ middle initials were included (but DuckDuckGo had no problem finding it).
|