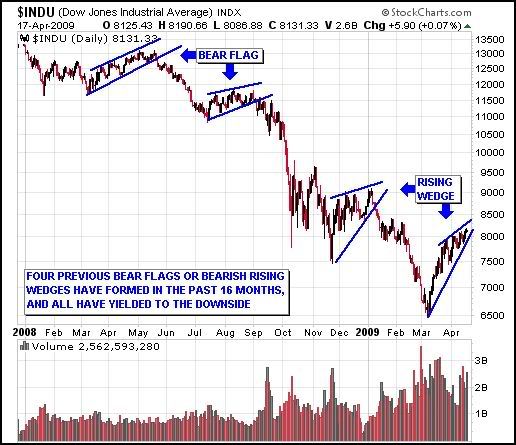
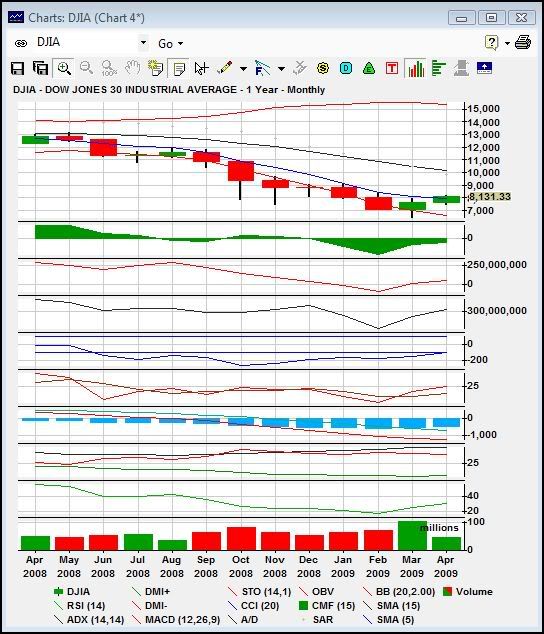
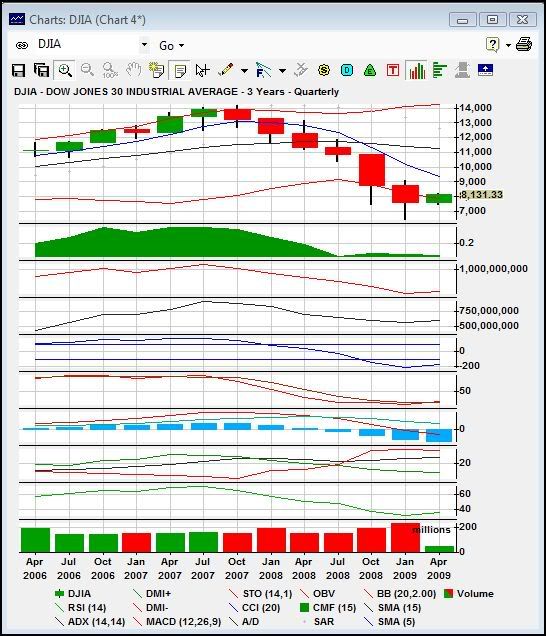
Chart and Fundamental Analysis of the $DJIA...
Daily, Weekly, Monthly, and Quarterly Video Charts are now available to view...With commentary on the Fundamentals of the overall market...
Click on the links below to view the two videos that are about 15 minutes long each:
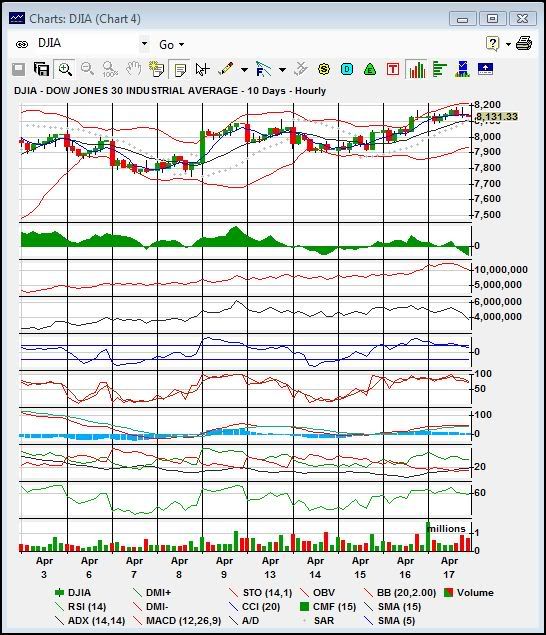
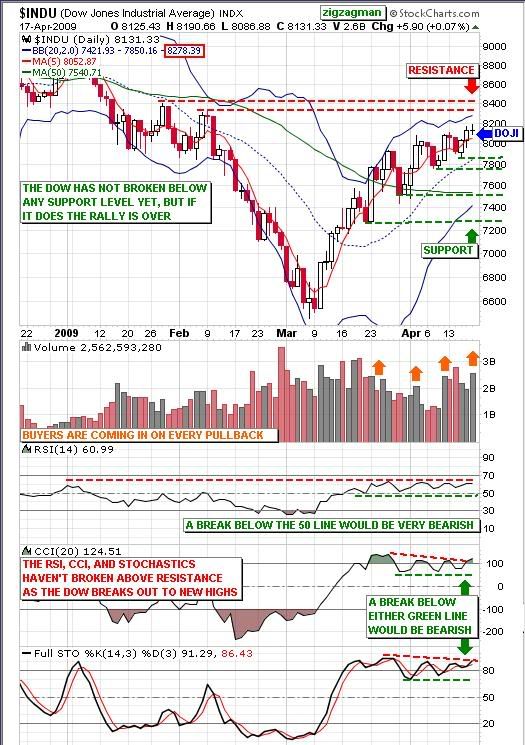
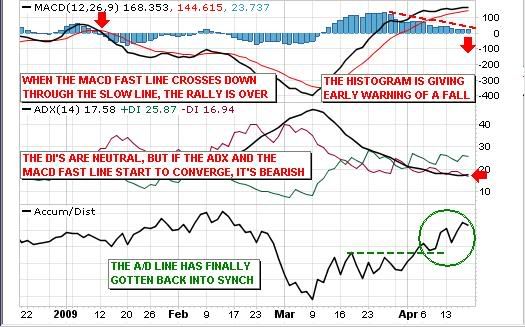
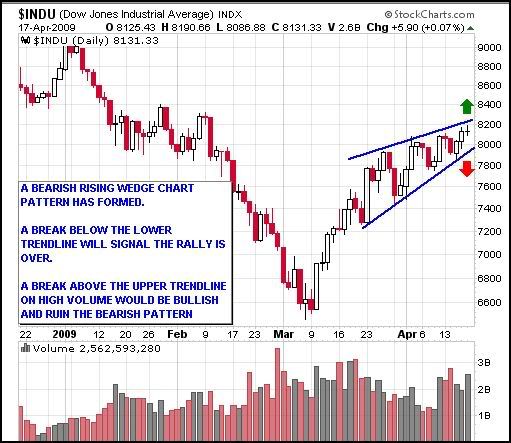
Daily chart:
adserv.stocksite.com
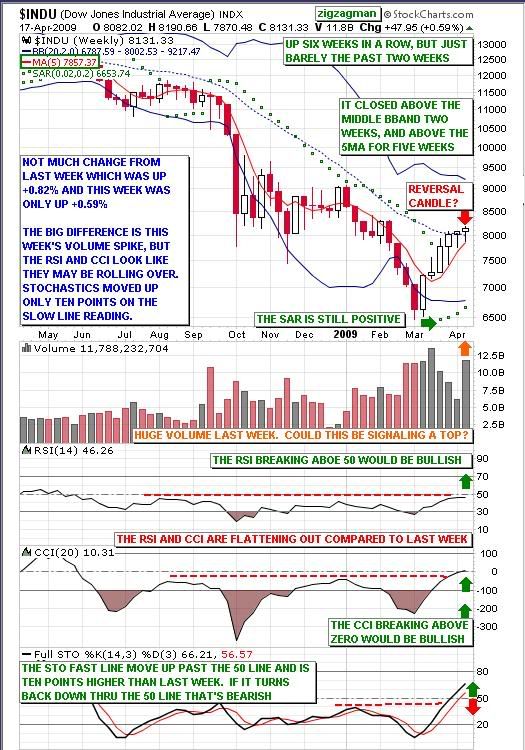
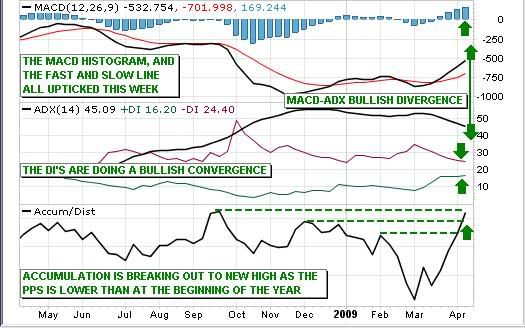
Weekly, Monthly, and Quarterly charts:
adserv.stocksite.com
This will be the last time I post these end of the week Video Charts...
It takes way too many hours out of my weekend to do this much work that is not appreciated by enough people to make it worth my while...
I get one or two people responding back to me each week that they look forward to these videos, and that's not enough encouragement or motivation to keep me doing this anymore...
It takes over twelve hours to do the research, create the videos, upload them, and then post them on six different websites...
I will still do the research, because it helps me to get a clear understanding of what to look for in the upcoming week...Which really isn't necessary for me to do since I am nothing more than a true Day Trader...
I only need to look at the one, five, fifteen minute, and hourly charts to do my job successfully...I also use the daily and weekly charts to some extent, but my time frames are much different from people that hold stocks overnight, which I never do anymore...
I hope you all enjoyed these Video Charts, and learned something about how Technical Indicators work...In my strategy, I use the same indicators and Buy and Sell Signals for Day Trading as I do for Swing Trading...All you have to do to Swing Trade successfully is to use longer time frames on your charts...
Happy Trading this week, and Good Luck!...
zigzagman
 |


