Daily Presidential Tracking Poll
Related Articles
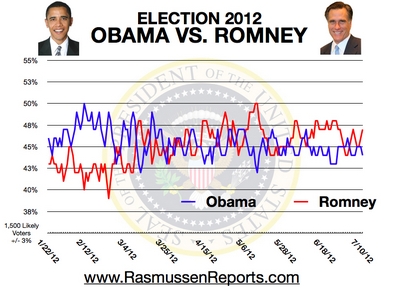
Tuesday, July 10, 2012
The Rasmussen Reports daily Presidential Tracking Poll for Tuesday shows Mitt Romney attracting 47% of the vote, while President Obama earns support from 44%. Five percent (5%) prefer some other candidate, and four percent (4%) are undecided. Platinum Members can see detailed demographic and other information daily.
Voters see a clear choice between Romney and Obama on the health care issue but are not convinced that the economy will improve no matter who's elected president in November. Just 32% believe the economy will get better if Obama is reelected, while 36% say the same about a Romney victory.
Matchup results are updated daily at 9:30 a.m. Eastern (sign up for free daily e-mail update). See tracking history.
Republicans hold a three-point advantage on the Generic Congressional Ballot.
Voters strongly support an extension of the Bush tax cuts but are evenly divided over whether they should be extended for all Americans or just for those who earn less than $250,000 a year. Two-out-of-three Americans believe the nation is already overtaxed. Most believe raising taxes hurts the economy. Fifty-one percent (51%) believe taxes will go up if the president is reelected, compared to 31% who expect higher taxes if Romney wins.
Additionally, 66% believe the government should cut spending to help the economy. Most voters doubt that spending will be cut regardless of who wins the White House.
Half (49%) favor a proposal that would prevent federal, state and local governments combined from taking more than 30% of anyone’s income in taxes. Thirty percent (30%) are opposed.
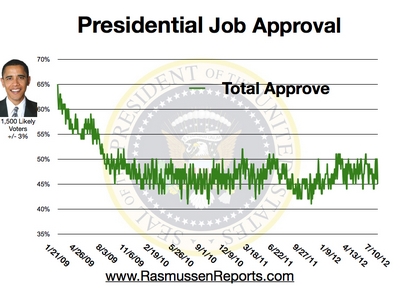
(Presidential Job Approval Data Below)
A president’s Job Approval rating is one of the best indicators for assessing his chances of reelection. Typically, the president’s Job Approval rating on Election Day will be close to the share of the vote he receives. Currently, 45% of voters say they at least somewhat approve of the president's job performance. Fifty-three percent (53%) at least somewhat disapprove ( see trends).
New numbers on the health care law show that 53% of voters nationwide still favor repeal of the health care law. In his weekly newspaper column, Scott Rasmussen notes that the health care plans put forth by the president and Republican Congressman Paul Ryan are both unpopular because “ no one wants their health care choices being made by government officials, insurance companies or their employer. People want to make those important decisions themselves.” He adds, “Putting consumers in charge would require pretty radical change, but it's the type of change voters could support.”
If you’d like Scott Rasmussen to speak to your organization, meeting, or conference, please contact Premiere Speakers.
Most Americans want the federal government rather than state governments to regulate banks and financial institutions. At the same time, most think states should control gambling and the minimum wage. On other issues, from health insurance to drilling for oil, the nation is more evenly divided.
Looking to the Electoral College swing states, Obama leads in New Hampshire, Pennsylvania and Michigan. Romney leads in North Carolina and Missouri. The race is a toss-up in Wisconsin, Iowa, Ohio, Virginia, Florida and Colorado.
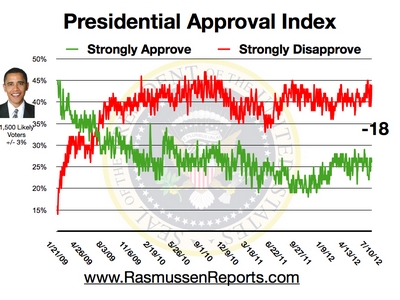
(Approval Index data below)
Intensity of support or opposition can have an impact on campaigns. Currently, 26% of the nation's voters Strongly Approve of the way that Obama is performing his role as president. Forty-four (44%) Strongly Disapprove, giving him a Presidential Approval Index rating of -18 ( see trends).
During midterm elections, intensity of support can have a tremendous impact on turnout. That was demonstrated in 2010 when Republicans and unaffiliated voters turned out in large numbers to express opposition to the Obama administration’s policies. However, in presidential election years, there is a smaller impact on turnout.
To get a sense of longer-term Job Approval trends for the president, Rasmussen Reports also compiles our tracking data on a full month-by-month basis.
(More below)
Rasmussen Reports is a media company whose work is followed by millions on a wide variety of platforms. We regularly release our results at RasmussenReports.com, through a daily email newsletter, a nationally syndicated radio news service, an online video service and a weekly newspaper column distributed by Creators Syndicate. A nationally syndicated TV show-- What America Thinks --is scheduled for launch in September 2012.
Our firm has been a pioneer in the use of automated telephone polling techniques, but many other firms still utilize their own operator-assisted technology ( see methodology). Pollsters for Presidents Jimmy Carter and Bill Clinton have cited our " unchallenged record for both integrity and accuracy."
During Election 2008, Rasmussen Reports projected that Barack Obama would defeat John McCain by a 52% to 46% margin. Obama was 53% to 46%. In 2004, Rasmussen Reports was the only firm to project the vote totals for both candidates within half a percentage point. Learn more about the Rasmussen Reports track record over the years.
Daily tracking results are collected via telephone surveys of 500 likely voters per night and reported on a three-day rolling average basis. To reach those who have abandoned traditional landline telephones, Rasmussen Reports uses an online survey tool to interview randomly selected participants from a demographically diverse panel. The margin of sampling error for the full sample of 1,500 Likely Voters is +/- 3 percentage points with a 95% level of confidence. Results are also compiled on a full-week basis and crosstabs for full-week results are available for Platinum Members.
Like all organizations that conduct public opinion polls, Rasmussen Reports weights its data to reflect the population at large ( see methodology). It is important to remember that the Rasmussen Reports job approval ratings are based upon a sample of likely voters. Some other firms base their approval ratings on samples of all adults. Obama's numbers are almost always several points higher in a poll of adults rather than likely voters. That's because some of the president's most enthusiastic supporters, such as young adults, are less likely to turn out to vote.
Among other targets, Rasmussen Reports weights data by political party affiliation using a dynamic weighting process. While partisan affiliation is generally quite stable over time, there are a fair number of people who waver between allegiance to a particular party or independent status. Our baseline targets are established based upon separate survey interviews with a sample of adults nationwide completed during the preceding three months (a total of 45,000 interviews) and targets are updated monthly. Currently, the baseline targets for the adult population are 35.4% Republicans, 33.6% Democrats, and 30.9% unaffiliated. |


