    Hi AJ, Hi AJ,
I agree with you.... Mark Hulbert's early January forecast of the SPX being at 1525 on June 30tit was a very prescient forecast of both time and price...speaking to your comment of the financial forming a bullish cup and handle at the end of 2012 and leading to a bullish break out to the upside... and since the financials lead early in rallies and fade and roll over latter in bull market moves indicating that a topping action is on the horizon is also an excellent observation.
going the way back to the late 1990's .. When Cramer was still involved with his hedge fund he had his partner.. Berkowitz... writing notes on the street.com on what he was looking for as a trader.... four groups that he would focus on were the BKS... bank index, The SOX, semidconductor sector, the Biotech sector, and a fourth one which I might have been the Brokers....
at the time it was very useful each day to see how those 4 groups were acting and what their charts looked like on a daily basis.... and on hourly charts..... and then look at how those 4 key groups were doing relative to the NASD, the NASD 100, the SPX , the Russell averages etc.
Financials are early movers when we are getting into a bullish period and they were deteriorating and rolling over prior to the Price top on May 24.
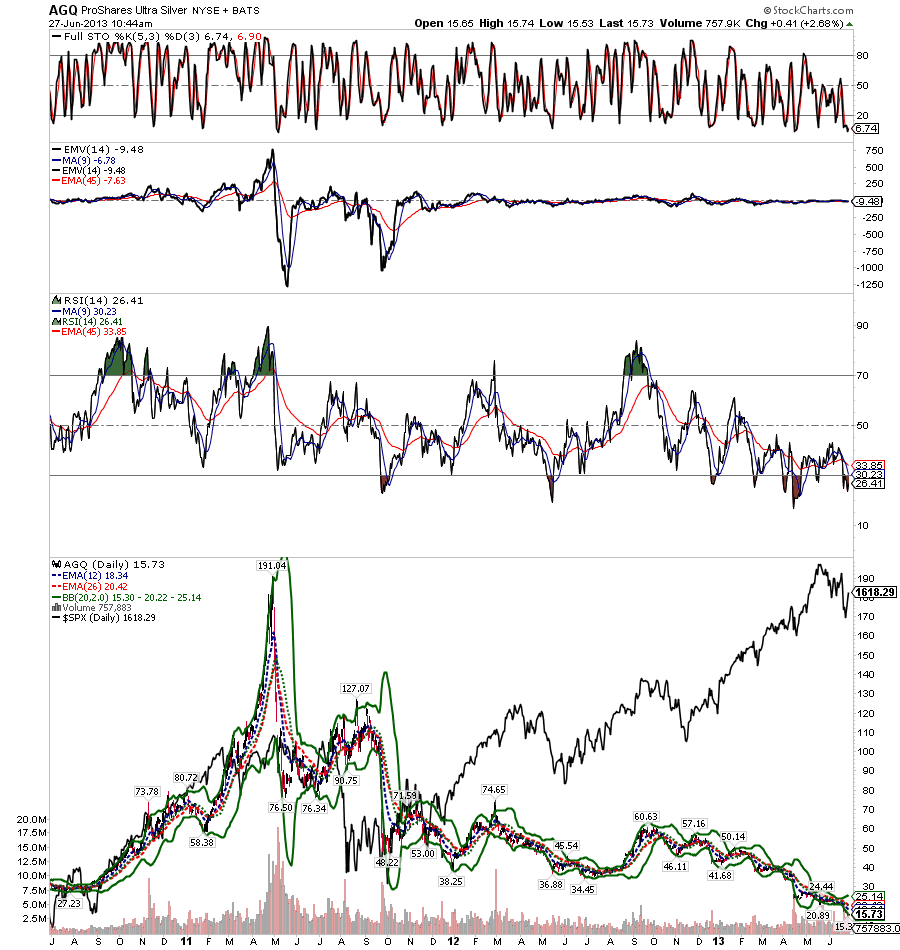
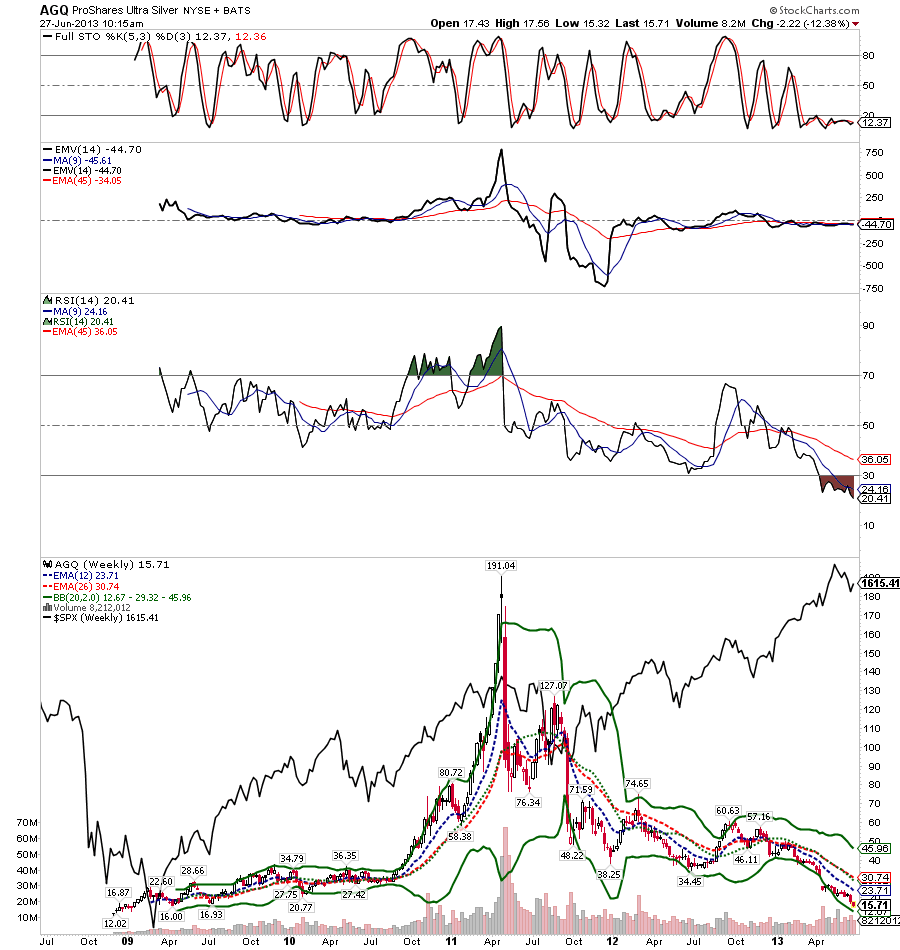
I wanted to look at the Gold and Silver sector.... Dr. John Najarian...was commenting that he was buying a little of the AGY which is the pro Silver Share ETF... he was buying some on a trading basis ... very short term.
When I look at it on a weekly Basis we can see that It still has not created momentum divergences , although looking at the daily chart it is very over sold, very unloved and has create a very nice bullish momentum divergence for a "trading rally" over the next 3 to 5 weeks.... the 60 minute chart says that we are not at the rally point yet and as the RSI and other indicators are still in sell mode..... Over all Gold and Silver ares still in a firm downtrend and it reiterates the theme that we are having a gobal slowdown.... and that inflation in so many areas of the Globe is not very strong at all, due to the continued ultra slow pace of the velocity of money and the consumer contracting in Europe, Asia, South America.... etc with the Emerging markets equities being in a bear market and countries like China, India, Brazil.... The BRIC countries all having a economic contractions and this should create a recession over the next several quarters.and hence, risk assets are being sold, and the US ten year note is coming back down in yield it will retrace those gaps as you pointed out
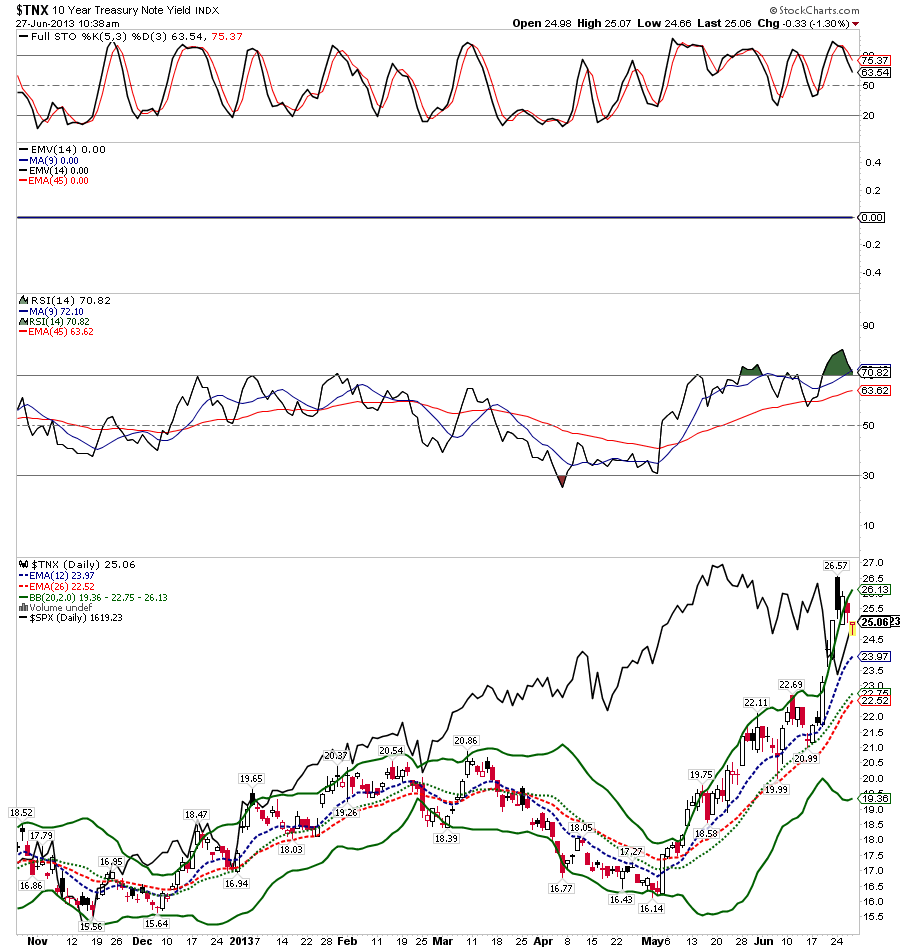
The daily 10 year note yield shows that rates will be coming back down several basis points... and we will end the 2nd Quarter with a strong week and next week should see the US rates coming down in Yield up in price.
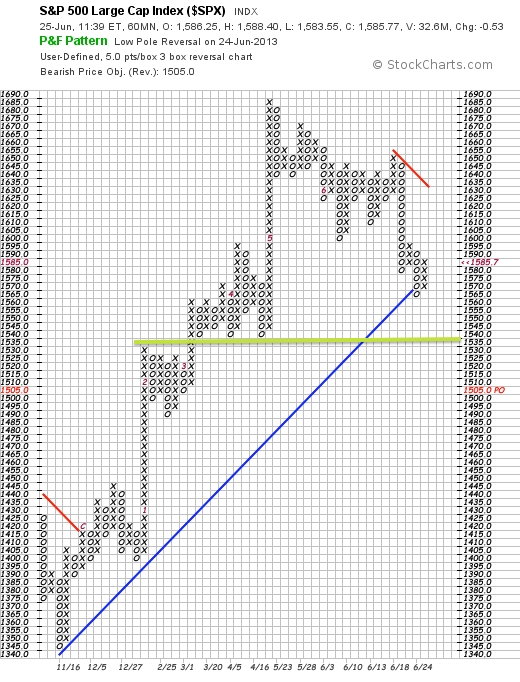
I have included a point and fgure chart of the SPX 500 index which shows that we have had some technical damage done to the uptrend and thus the decline we have seen in US equities is probably not over and we will most likely be looking at a test of the 200 Day Moving Average..... and even a break underneath it after our countertrend really which began on monday plays itself out over the rest of this week, the Holiday shortened ffirst week of July and .... the counter trend rally which should have up days and down days should carry into a secondary lower top probably around Weds. July 17th..... if this scenerio plays out.... people will be feeling quite bullish about US equities at that point and it will make for another excellent opportunity to reduce asset allocation to Equities and risk assets and to increase longer term postioning shorts .
John
.
John
Jo |


