Here is where I am with this nightmare....
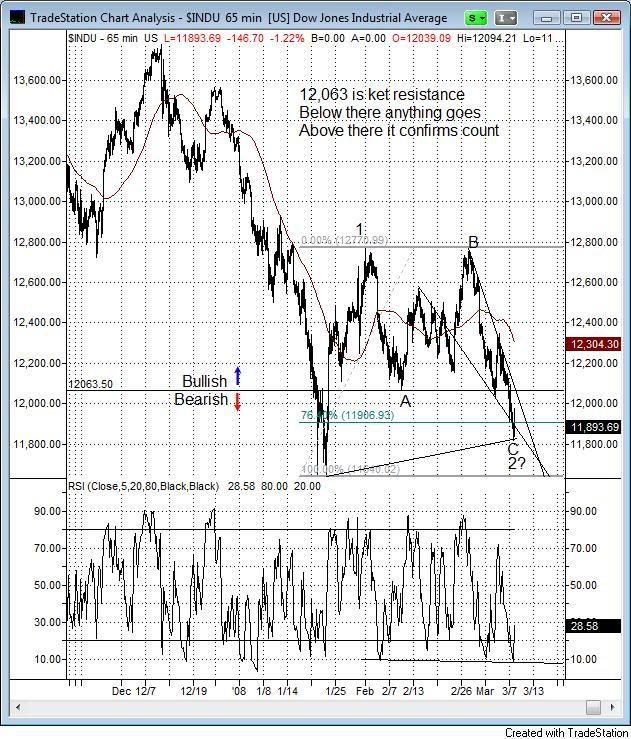
Hourly chart still support wave 2 finishing somewhere in here.
I have to emphasize that until 12,063 is taken out on the upside, there is downside risk. The current backdrop does support then ending of wave 2....Extreme PC ratio's, nothing but bad news, as mc put it, "blood on the street's" and all over my brokerage statements.....
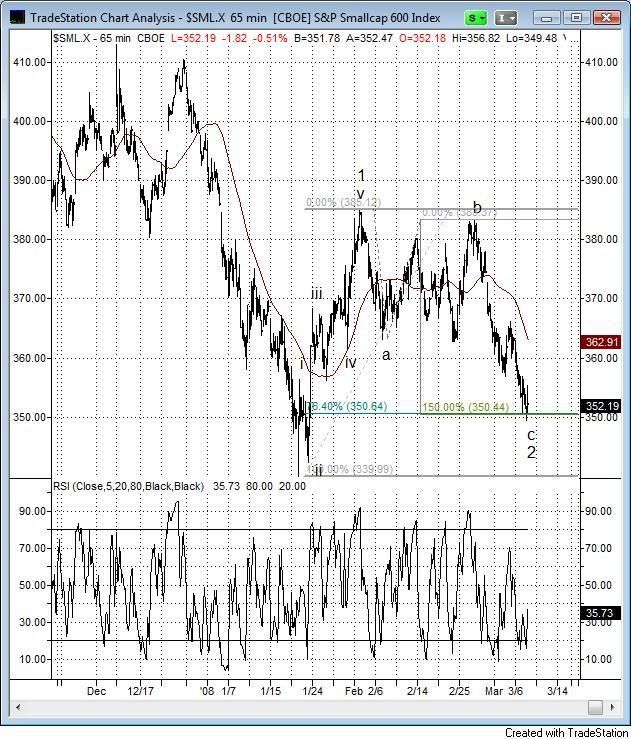
SML
Today's low is coincident with 76.4% of the Jan advance and c = 1.5 x a
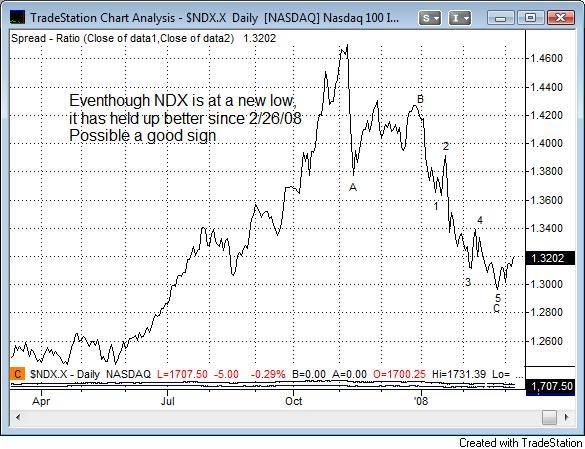
NDX/SPX Ratio
Even with a new low in the Nasdaq, this ratio is moving up..it means that the Nas 100 is holding up better on this wave down and hopefully it is signaling a bottom - just like it signaled the top in Oct
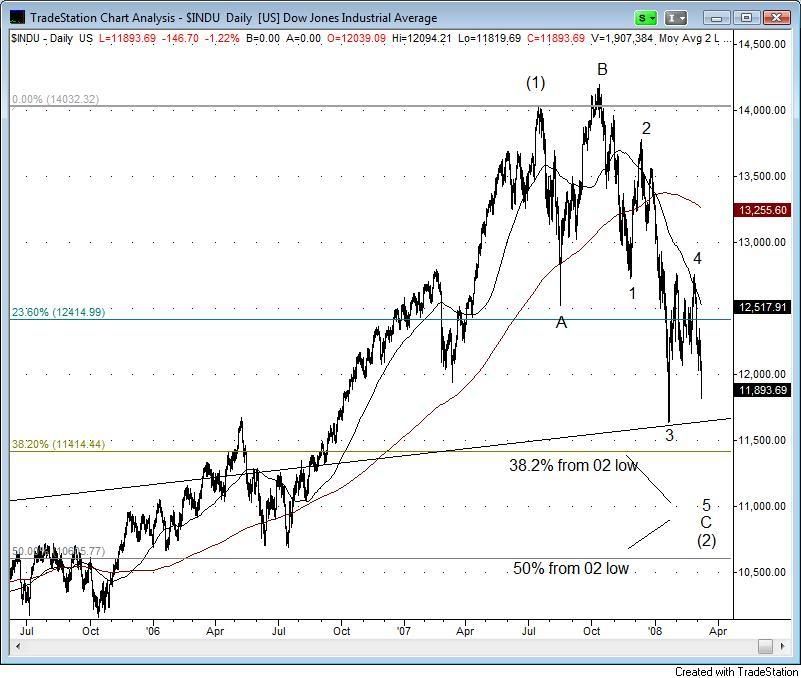
Until 12,063 is taken out, the risk remains that a 5th wave could develop to new lows (as everyone else here has been warning me about)
If this were to occur, the 2 numbers I am looking at are
11,400 38.2% of the entire advance from 2002-2007
10,605 50.0% of the entire advance from 2002-2007
If this occurs, I think it completes a larger wave (2) and not a wave (4) that I think is the Jan low.
Other markets.
Bonds down
Dollar bottoming (may have been today - good indication)
Gold topping (may have been this week -average indication)
Oil topping (may have been this week - although no sign of it) |


