SI
SI
discoversearch

We've detected that you're using an ad content blocking browser plug-in or feature. Ads provide a critical source of revenue to the continued operation of Silicon Investor.  We ask that you disable ad blocking while on Silicon Investor in the best interests of our community.  If you are not using an ad blocker but are still receiving this message, make sure your browser's tracking protection is set to the 'standard' level.
Gold/Mining/Energy : Gold and Silver Miners and the U.S Markets.

 Public ReplyPrvt ReplyMark as Last ReadFilePrevious 10Next 10PreviousNext  
To: The1Stockman who wrote (1934)6/26/2014 9:06:13 PM
From: Robov  Read Replies (1) of 1954
 
I am frankly just a miffed as you James. Both metals are overbought on the daily charts with gold's RSI floating at the 70 level so there is room to move higher. Silver on the other hand has had an RSI at 80 or just above since the big move higher last week. An RSI above 80 - 90 is extreme overbought in my books, yet not correction and in fact silver keeps pressing higher. It has actually managed higher closes each day since the big surge last Thursday. July is an active delivery month for silver and given that 7 + million ounces has been moved out of the SLV on rising prices (contrary to what should happen) it seems clear that silver is in short suplly. Add to that the record short position held by the Spec sheep and of course JPM's still massive short. Silver seems to have a lot of rocket fuel beneath it.
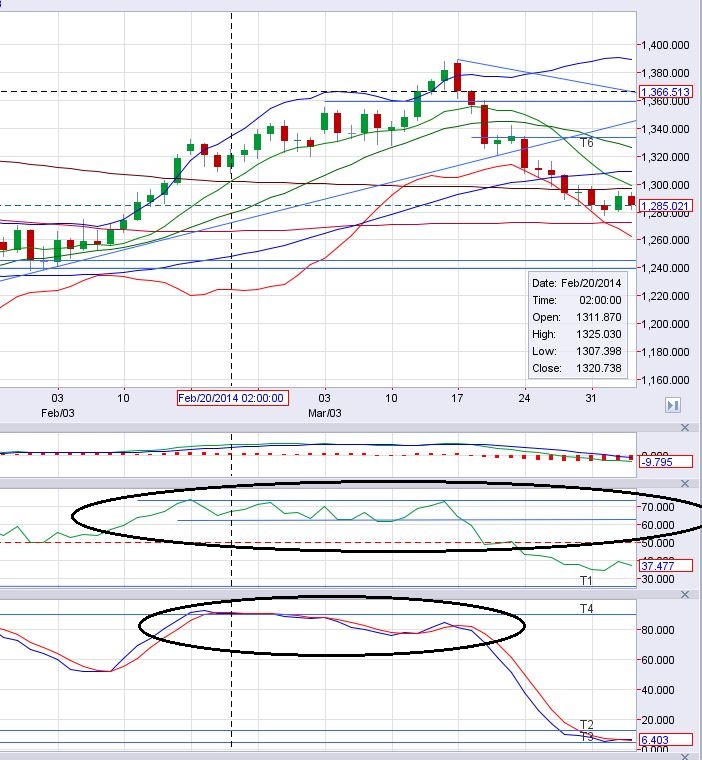
Gold on the other hand although definitely overbought on the daily still has a little room with momentum that seems to have run out. But if I look back to the big move up from February to mid March once gold broke through the 1250/70 region the RSI spent a month floating between 75 on the high side and about 60 on the bottom side until we hit that top. Stochastic also stayed moved side ways for quite sometime.

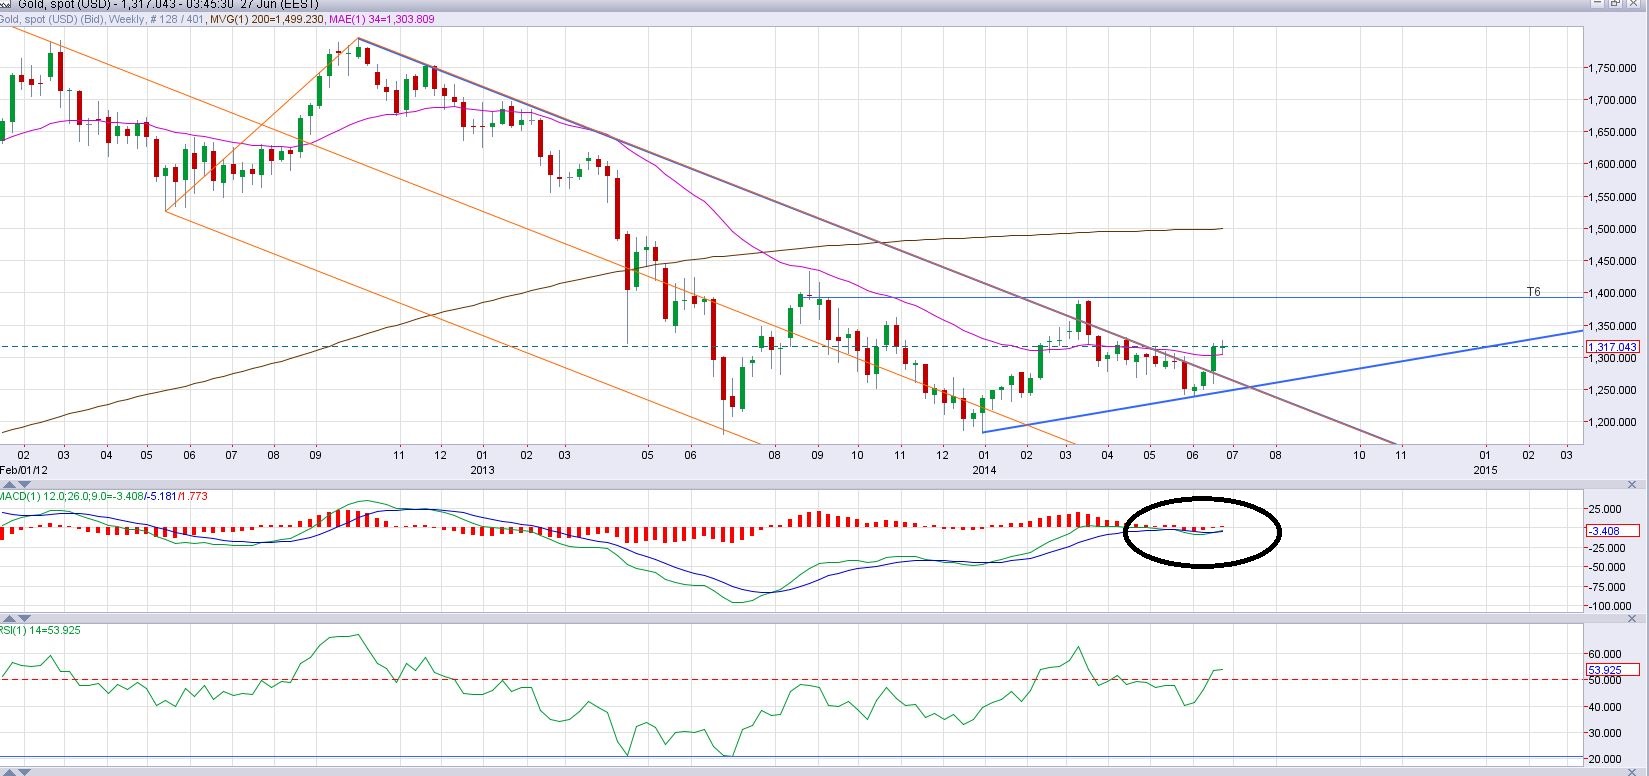
A look at the current situation you can see that the RSI has been moving sideways just below and above the 70 line and the Stochastics is just starting to top out and turn. Based on the chart above it could go sideways for some length of time as gold slowing creeps higher. That move last week took gold through two downtrend lines and the 50, 100, and 200 SMA's. The 50 SMA has just crossed back above the 200 SMA. You can also see that although price has been capped at around 1316 every attempt to move price lower has also been bought back up. Like I said a real battle going on here right now. Maybe the reality of the economic recovery (which is NO recovery at all) is starting to finally sink in. A dismal GDP, food inflation, energy inflation. This 2% inflation the Fed keeps spouting is absolute HOGWASH. Maybe this reality is kicking in and of course gold is a hedge against inflation. We have all the overseas stuff going on the de-dollarization of the USD by more and more nations. The list of Black Swans is endless.


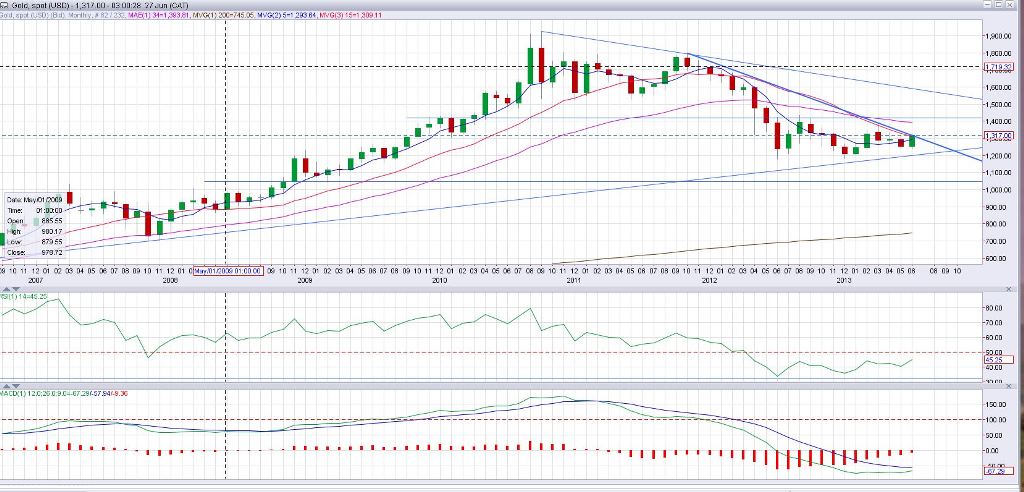
You can see on the weekly gold chart that we have once again crossed above the LT down trend line going all the way back to 11/13 and the MACD has just crossed over which is usually a buy signal. On the monthly chart the MACD is as low as it has ever been on my chart going all the back to 1995 as far back as the Netdania chart goes and is in the process of turning back up.


The monthly MACD has never been lower than about -20's going back to 1995 and currently sits at -67. As you can see on the monthly the price is right up against the downtrend line and the MACD is not to far away from crossing. So aside from the over bought conditions on the daily both the weekly and monthly are quite frankly rather bullish IMO. Then you add to the the record volumes coming into not just the GDX/GDXJ as they carve out a perfect H & S bottom plus the miners. The anomaly to me is the Broad markets as they are not acting as they should and would be toast by now if not for the manipulation.
Report TOU ViolationShare This Post
 Public ReplyPrvt ReplyMark as Last ReadFilePrevious 10Next 10PreviousNext