Questions we hear a lot


John P. Hussman, Ph.D.
President, Hussman Investment Trust
January 2019While we don’t presently observe conditions to look for a ‘buying opportunity’ or a ‘bottom’ from a full-cycle standpoint, we do observe conditions that are permissive of a scorching market rebound, even if it only turns out to be the ‘fast, furious, prone to failure’ variety. We wouldn’t dream of removing our safety nets against a market decline that I continue to expect to draw the S&P 500 toward the 1000 level by the completion of this cycle. Still, we’ve prepared for the possibility of unusual volatility here, most likely including one or more daily moves in the range of 4-6%, potentially to the upside. Yes, that means one or more daily moves on the order of 100-150 points on the S&P 500 and 900-1300 points on the Dow. You think I’m kidding.”
– John P. Hussman, Ph.D., Interim comment, Pre-open, 12/26/18
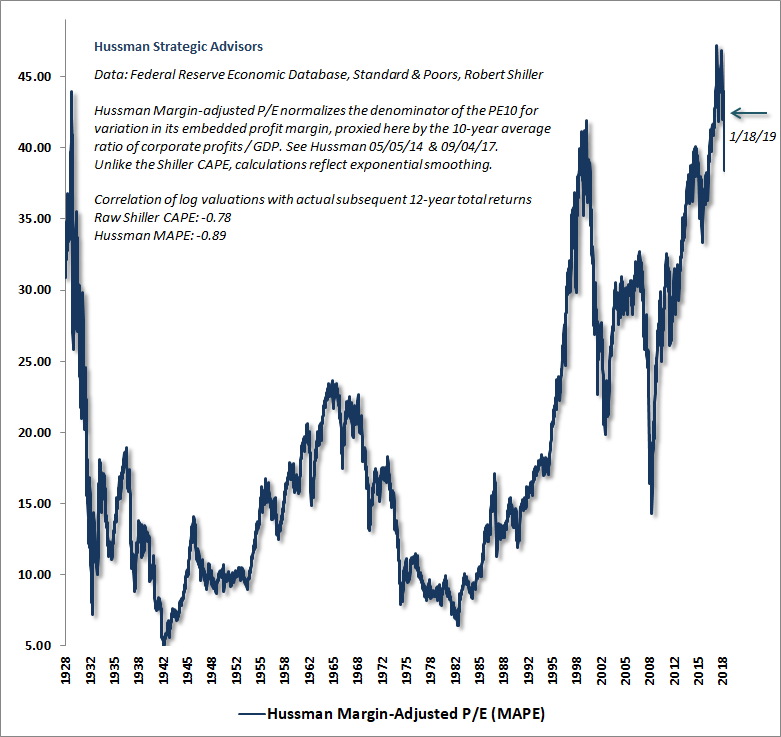
In recent days, we’ve heard a number of analysts gushing that the S&P 500 is vastly cheaper than it was only a few months ago. It’s worth noting that they’re actually referring to an index that is now less than 10% below the steepest speculative extreme in history. The chart below puts current valuations into perspective, using our Margin-Adjusted P/E, which is better correlated with actual subsequent 10-12 year market returns than the price/forward operating earnings ratio, the Shiller CAPE, the Fed Model, and a wide range of alternative valuation measures that Wall Street uses to reassure investors that valuations are anything less than obscene.
As market conditions currently stand, valuations remain extreme and market internals remain negative. So aside from the likelihood of a knee-jerk market spike on any variant of the word “deal,” we continue to be in a trap-door situation with respect to market risk. Though we did take the edge off of our negative outlook to allow for a scorching relief rally, my present view is that the overall function of that relief rally has been served.
Still, it’s important to be clear – and this point is central to the adaptation that we made to our approach back in 2017 – if our measures of market internals were to improve, signaling a shift of investor psychology away from risk-aversion and toward speculation, we would expect to adopt a constructive market outlook, though undoubtedly with a safety net given present valuation extremes. There’s still too much divergence across individual securities, industries, sectors, and security-types to identify that sort of shift here, but we can’t rule it out. We’ll take that evidence as it comes.
What I can say, unequivocally, is that at points where our measures of market internals become favorable, we will not adopt or amplify a negative market outlook, regardless of how extreme market valuations may be. We learned the hard way in this half-cycle that we can no longer rely on any limit to the recklessness of Wall Street once speculators get the bit in their teeth. Again, safety nets would be essential in any event, but if internals shift, so will our outlook.
As market conditions currently stand, valuations remain extreme and market internals remain negative. So aside from the likelihood of a knee-jerk market spike on any variant of the word “deal,” we continue to be in a trap-door situation with respect to market risk. Though we did take the edge off of our negative outlook to allow for a scorching relief rally, my present view is that the overall function of that relief rally has been served.
As a side-note, I’ve renamed the measure above to the Margin-Adjusted P/E (MAPE) rather than the Margin-Adjusted CAPE. The reason is that it seems to be confused for Robert Shiller’s cyclically-adjusted P/E (CAPE). So MAPE it is.
Notably, the MAPE also avoids certain statistical artifacts, such as the fixed 10-year window that will bump Shiller’s CAPE down by about 10% as depressed earnings from the 2008-2010 period roll off, making the CAPE look “cheaper.” This seemingly cheaper Shiller CAPE will emerge only by virtue of restricting the denominator to earnings achieved purely during an economic expansion that, at 114 months, is now only marginally shorter than the 120-month expansion that peaked in March 2001.
On a related note, for those waiting for a recession as a signal to become more conservative about market risk, recall that by the economic peak in March 2001, the S&P 500 was already a year into a bear market that had taken the index down by -27%, and would, by October 2002, take the index down by another -30% from there.
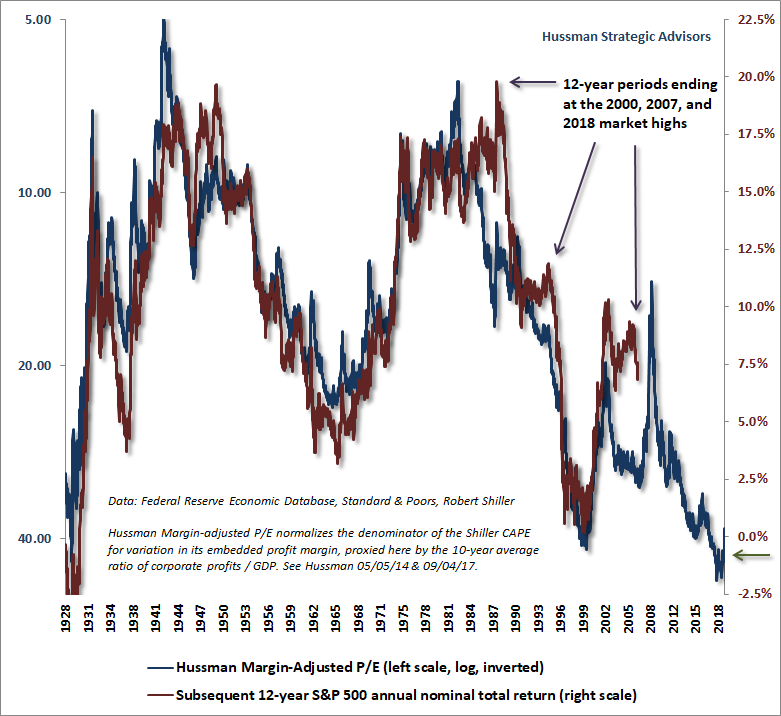
Pricing stocks on peak earningsThe fact is that in market cycles across history, margin-adjusted measures are far better correlated with actual subsequent market returns than unadjusted price/earnings measures. On that subject, it’s useful to remember the words of the legendary Benjamin Graham, who warned about pricing stocks based on earnings figures at the peak of an economic cycle: “The purchasers view the good current earnings as equivalent to ‘earning power’ and assume that prosperity is equivalent to safety.”
Say what you like about using margin-adjusted measures as an improved “sufficient statistic” for the very long-term cash flows that U.S. equities deliver over time. These measures are far better correlated with actual subsequent market returns than alternative earnings-based measures like price/forward operating earnings. In over a century of data, these measures are also far better correlated with the discounted sum of actual subsequent cash distributions that the S&P 500 has delivered to investors over time.
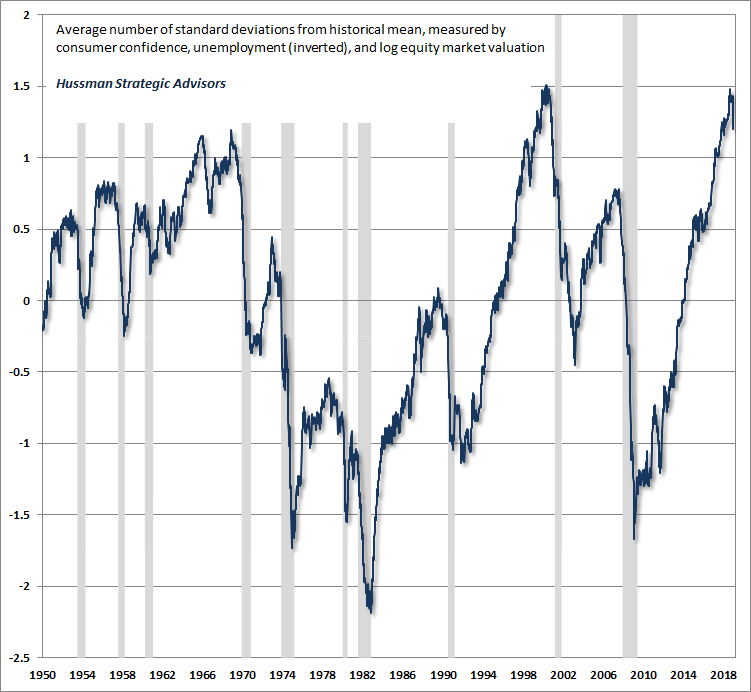
Even when we see periodic divergences between actual S&P 500 total returns and those one would have projected 10-12 years earlier, those divergences are correlated with the level of consumer confidence at the end of the period, which is another way of saying that while valuations drive long-term returns, temporary extremes in valuation are generally related to cyclical extremes in investor psychology.
One of the more cringe-worthy features of the behavior of investment professionals here is the spectacle of Wall Street analysts touting the “reasonableness” of valuations on the basis of year-ahead earnings expectations that they themselves are responsible for fabricating. Just as in 2000 and 2007, instead of the investment profession acting as a historically-informed buffer to defend investors against reckless speculation, extrapolative projections like these are actually endorsed and encouraged by the very people who should know better. The chart below is thanks to TopDownCharts.
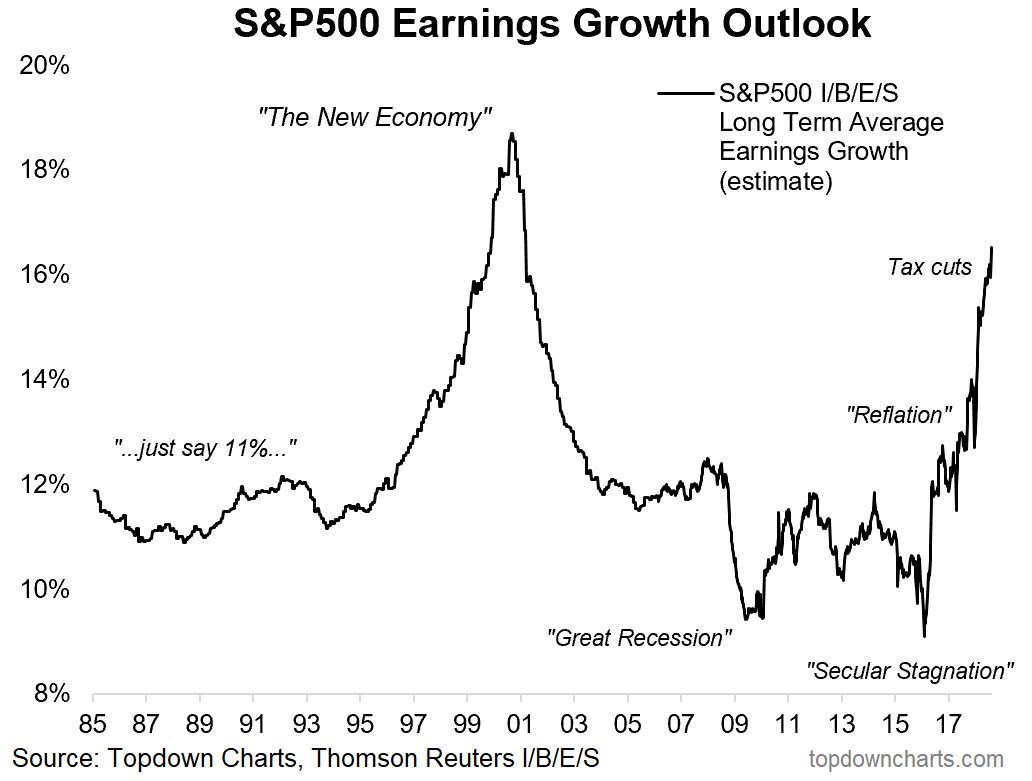
So-called “long-term” earnings projections of this magnitude are particularly offensive given the fact that, measured from the peak of the economic cycle in 2007 to the current peak, actual S&P 500 reported GAAP earnings have grown at an average rate of just 3.8% annually, with revenues growing at just 2.7%.
Measuring from the economic cycle peak of 2000 to the present gets you an average peak-to-peak earnings growth rate of just 5.1% annually, with revenue growth of 3.4%. Notably, those figures fully include the impact of stock repurchases (which reduce the S&P 500 divisor), as well as the record profit margins of recent years.
If anything, future earnings growth is likely to fall short of even what we’ve observed over the past couple of decades. The reason, as I’ve noted previously, is that the real structural growth rate of the U.S. economy – the sum of demographic labor force growth and trend productivity growth – is now down to just 1.4%. The faster growth rate of real GDP in recent years has been entirely the result of a decline in the rate of unemployment, which now stands at just 3.9%.
Barring a further persistent decline in unemployment, we’re likely to observe a slowing of real GDP growth toward 1.4%, even if the economy avoids a recession. Add 2% inflation, and earnings growth is likely to slow to less than 4% annually even if profit margins remain near recent highs. By contrast, an economic contraction of any magnitude at all is likely to produce a “surprising” plunge in S&P 500 index earnings.
Though we constantly hear that recent reductions in corporate tax rates will justify permanently higher corporate profit margins, the historical fact is that U.S. corporations have generally competed on the basis of after-tax profit margins. Specifically, in data since 1947, reductions in nonfinancial corporate tax rates have been accompanied by similar reductions in nonfinancial pre-tax profits, so that after-tax profit margins have increased by far less than one might have expected as a result of those tax cuts.
On the subject of errors, it’s one thing to err because something happens that violates all evidence from history, but it’s another to repeatedly make the same mistake as a result of ignoring history altogether. It seems to me that ignoring extreme valuations – and pricing stocks based on earnings projections that have no link to the way earnings have behaved across history – is an error of the second type.
I regularly admit my own error in the recent advancing half-cycle, particularly because I hope it can be instructive. Despite anticipating the 2000-2002 and 2007-2009 collapses, and admirably navigating decades of complete market cycles prior to 2009, I made a very specific error in the recent half-cycle that was detrimental. The error was my bearish response to severe “overvalued, overbought, overbullish” syndromes that had regularly been followed by air-pockets, panics, and crashes in market cycles across history, but failed to place any limit on speculation in the face of zero interest rate policies.
In late-2017, I finally threw up my hands and abandoned the idea that we could rely on any historically-defined “limit” to speculative recklessness. Instead, I resolved that whenever our measures of market internals are uniformly favorable (which we use to gauge speculative pressures, because speculators tend to be indiscriminate), we would rule out adopting or amplifying any bearish outlook in the future. No exceptions. Period. Sufficiently extreme conditions can push us to a flat, neutral outlook, but never to a bearish one unless ragged and divergent internals indicate that investor psychology has shifted from speculation to risk-aversion.
The role of history and evidence is to provide us with something we can learn, and apply in the future. There’s no question that the world can change in ways that violate past experience and offer new learning. But my sense is that the best kind of learning is coherent – you take the new evidence to shift your understanding in a way that makes it consistent with the entirety of experience again. You don’t just abandon everything you know and shrug, “Well, it’s a brand new world.” For our part, prioritizing market internals is sufficient to make things coherent again – the fact is that the entire total return of the S&P 500 from the 2007 peak to today occurred during periods where our measures of market internals were favorable, while nearly all of the 2007-2009 collapse (as well as the recent market weakness) occurred when they were not.
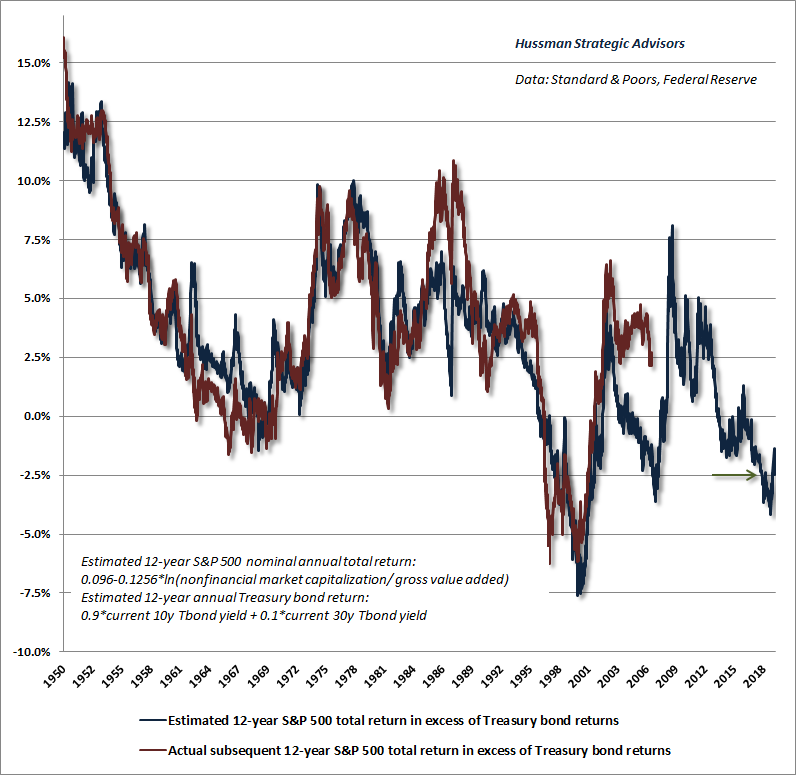
On the “competition” between stocks and bondsAnother danger for investors here is the willingness to accept offensively speculative valuations on the argument that bond yields are low. The empirical fact is that bond yields are tightly correlated with nominal GDP growth. But as one can demonstrate using any discounted cash flow model, if interest rates are low because growth rates are also low, no valuation premium is “justified” by the low interest rates at all. Long-term returns will already be lower, commensurate with the lower interest rates, by virtue of the lower growth rate itself. A valuation premium then just adds insult to injury.
To the extent that prospective returns on stocks are dismal, yet the yields on bonds barely provide a term premium over-and-above Treasury bills, the appropriate response is not to argue in favor of stocks, but instead to argue in favor of cash and alternatives like hedged-equity, particularly while market internals remain ragged and divergent.
Even when analysts recognize that rich market valuations will likely be associated with poor long-term returns for stocks, the observation is often coupled with a phrase like “but these expected stock market returns remain competitive with bonds.”
Two responses to that. First, no. Given the choice between stocks and Treasury bonds, even with their presently depressed yields, we would still expect higher returns and smaller downside risks from bonds.
Second, to the extent that prospective returns on stocks are dismal, yet the yields on bonds barely provide a term premium over-and-above Treasury bills, the appropriate response is not to argue in favor of stocks, but instead to argue in favor of cash and alternatives like hedged-equity, particularly while market internals remain ragged and divergent.
There are points in every market cycle when a material retreat in valuations is joined by an improvement in measures of market action and internals. It’s at that point that one should make a vigorous case for stock market exposure. Doing so just 10% below the steepest valuation extreme in history, in a market where investors remain inclined toward risk-aversion (which we read from the behavior of internals) is a measure of both 1) impatience with the market cycle and 2) a misguided sense of entitlement with respect to market gains that occurred as a result of speculative pressures that are no longer present.
The New EconomyWhile some analysts have argued that the current batch of glamour technology companies has boosted profit margins permanently, they seem wholly unware of the regularity with which this argument has been made across history. The argument is recurrently applied to a rotating group of companies that invariably become associated with the New Economy, as opposed to the defunct Old Economy upon which traditional valuation measures have been defined.
Here’s the problem. As any new technology advances from a small base, new product adoption by consumers can create astoundingly high growth rates and profit margins. But as market share approaches saturation, these “logistic growth” curves begin to plateau, and growth predictably slows toward zero. We observed exactly the same profile from the leading companies that dominated the 2000 market peak.
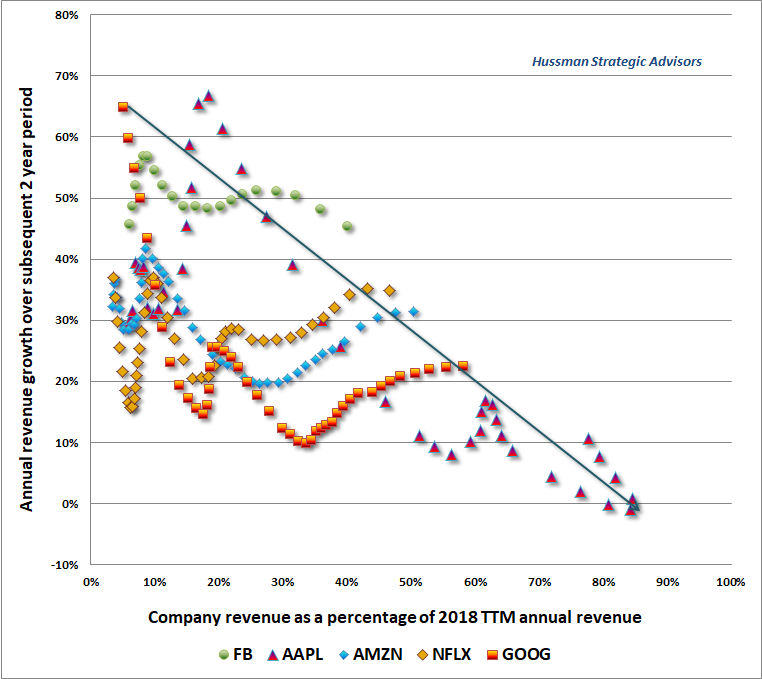
As I observed back in August 2000, and as is likely to unfold in rather the same way this time, “One of the hard lessons that investors will learn in the coming quarters is that technology stocks are actually cyclicals. Modest changes in economic growth and overall corporate profitability have a highly leveraged impact on the revenue growth and profitability of technology companies. Though economic growth is likely to slow only modestly, we are anticipating a plunge of 20% or more in the earnings of S&P 500 technology stocks in the coming quarters.”
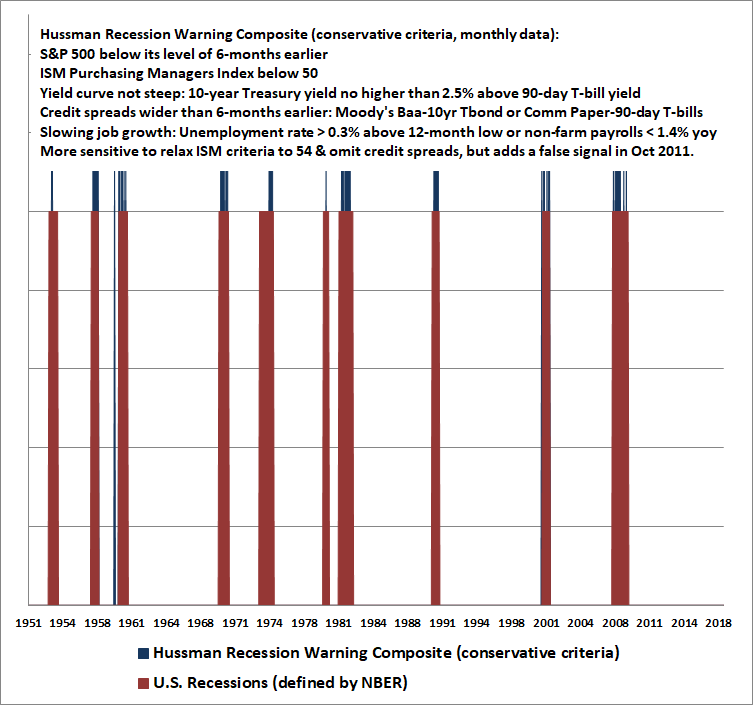
On recession riskThe next question, then, is whether the U.S. is nearing an economic recession. On that subject, we’re probably a bit less committal than one might imagine, because we’re still monitoring a few components of our Recession Warning Composite. Specifically, we’d be inclined to wait until we observe a decline in the ISM Purchasing Managers Index below 50, coupled with an uptick to an unemployment rate of anything above 4%, and a slowdown in year-over-year job growth to 1.4% from the current 1.8%.
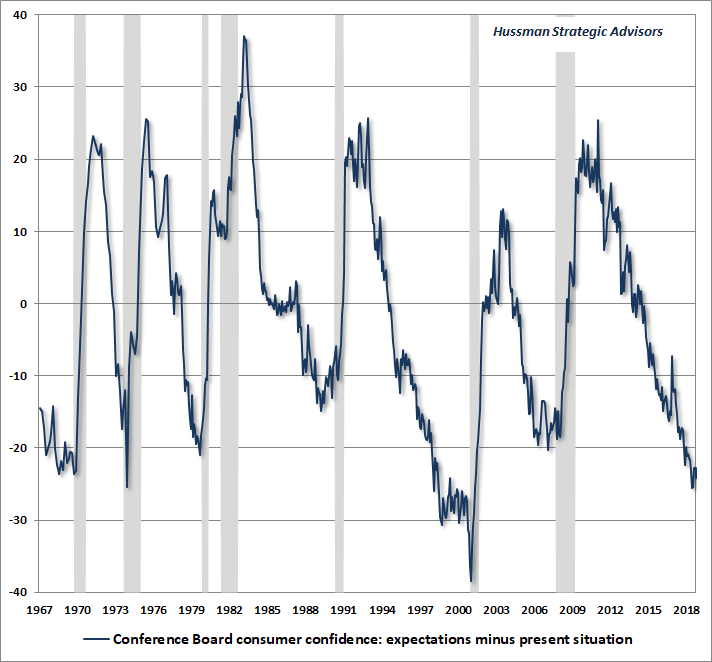
With regard to confirming measures, we’d also pay close attention to the “Consumer Confidence Spread,” as the Future Expectations index has been falling much more sharply than the Present Situation index. This behavior typically precedes recessions. Once the Present Situation index of consumer confidence drops by more than about 20 points below its 12-month average, a recession has typically started. A decline in aggregate hours worked, compared with 3-4 months earlier, is also a useful confirmation.
While I was one of the few observers that correctly anticipated the recessions that accompanied the 2000-2002 and 2007-2009 market collapses, my reliance on data that was subsequently revised produced false signals earlier in this recovery. So I’m inclined to be a bit conservative about identifying recession risk here. Moreover, given that valuations and market action already encourage a defensive market outlook, there’s really nothing to gain from a recession signal, since it wouldn’t really alter our investment stance.
Still, though we’re inclined to wait for more data, and to look for greater deterioration before identifying a recession, it’s important to remember how quickly the data can shift. The amount of time between the peak in economic confidence and the beginning of a recession is usually very short. In general, a uniform deterioration in financial, employment and economic confidence measures, even compared with 6 months earlier, strongly amplifies the risk of a recession, and there’s not much lead time at all. Put simply, we want to have a reliable set of confirming evidence, but it’s also important to remember how quickly that evidence can emerge.
Questions we hear a lotGiven the volatility of the financial markets in recent months, my sense is that the best comments to offer are those that relate to these questions:
Bull market or bear market?My impression is that the recent bull market peaked on September 20, 2018, which is also when we observed the largest preponderance of historically useful top signals we’ve ever seen. As I noted at the time, the only other point that came close was March 24, 2000, the date of the 2000 bubble peak. Still, the primary usefulness of a bull/bear label is to emphasize the potential for steep market losses over the completion of the cycle. As long as one recognizes that risk, there’s no need for labels.
It’s probably better to recognize that the market remains hypervalued and that market internals remain unfavorable. If internals improve at high valuations, our outlook is likely to shift to something that might be described as “constructive with a safety net.” If they improve at substantially lower valuations, we’re likely to move to an unhedged or aggressive stance. For now, there’s so much downside risk that we’d view an improvement in internals as a “bear market rally,” but whatever one might call it, we’d likely be constructive with a safety net. Even that, I suspect, is likely to emerge from lower levels.
Buy stocks or buy bonds?My impression is that neither provides much prospect for meaningful returns, and 10% off the most obscene valuations in U.S. history isn’t what I’d call a “bargain.” With the yield curve as flat as we currently observe, the main reason to own bonds is based on the likelihood of a decline in yields in the event of economic weakness. There’s some potential for that, but I’d lean toward a mix of Treasury bills, modest bond market durations, high credit-quality, and hedged equity. Our estimated return/risk profile for precious metals shares is also fairly strong here, but given the volatility of those shares, I’d characterize that as a constructive situation rather than an aggressive one. None of these is without risk.
Recession or continued expansion?We’re seeing a good deal of weakness in our leading measures, and a lot of the regional purchasing managers indices and Fed surveys are deteriorating as well, but we don’t have a sufficient basis for an outright recession warning. This expansion is very long in the tooth, unemployment is quite low, and the underlying structural growth factors are dismal. So my sense is we’re far closer to a recession than to 4% real GDP growth “as far as the eye can see.” Given the other factors already in place, be particularly watchful for an ISM Purchasing Managers Index below 50, a move above 4% in unemployment, and a slowdown in employment growth below about 1.4% year-over-year. A decline in aggregate hours worked versus 3-months earlier along with a steep drop in consumer confidence, particularly about 20 points below its 12-month average, would all be strong confirming evidence of an economic downturn.
More rate hikes or a new round of QE?On December 19, Fed Chair Jerome Powell observed “We’ve reached the bottom end of the range of what the Committee believes might be neutral.” I think that is exactly right. As I observed in the December comment, the combination of low structural economic growth and modest inflation pressure is fairly consistent with the current level of short-term interest rates. Long-term rates would normally be higher in the context of current data, but given the deterioration in leading economic measures (remember, payroll employment and the unemployment rate are two of the most lagging economic measures available), there’s little compelling upward pressure.
Don’t take hope in Fed intervention to support the market, other than knee-jerk reactions. First, remember that the Fed eased persistently throughout the 2000-2002 and 2007-2009 collapses with no effect. When investors are inclined toward risk-aversion, safe liquidity is a desirable asset, not an inferior one. My view is that it’s essential to monitor market internals directly. We don’t disclose the details of our own measures, but I’ve discussed uniformity, divergence, breadth, leadership, price-volume sponsorship, credit spreads, and other factors often enough that the central concept should be clear: when investors are inclined toward speculation, they tend to be indiscriminate about it.
If and when internals improve, virtually anything the Fed does will likely be associated with market gains. If internals continue to indicate risk-aversion among investors, then those knee-jerk “clearing rallies” would best be used as opportunities to sell marginal stock holdings and tighten up hedges.
My impression is that Jerome Powell is highly aware of how loose the cause-and-effect links are between monetary policy and the real economy. But apart from noting that the Fed’s workhorse economic model estimates only a 0.2% change in the unemployment rate after 3 years in response to each $500 billion in asset purchases, there’s nothing in his past speeches that indicates an intellectual opposition to QE. It’s not at all clear that the Fed recognizes its role in creating repeated cycles of bubble and collapse. So we have to allow for another round of QE in response to the next recession. Again, the appropriate response on our part will be to align ourselves with market internals. A favorable shift would likely encourage a constructive or aggressive investment outlook, particularly if valuations have retreated substantially at that point.
Inflation or deflation?One of the key features of the recent speculative episode has been yield-seeking speculation by investors starved for safe yields. In response, Wall Street and corporate America provided more “product” in the form of low-grade covenant-lite debt. Indeed, the median rating on U.S. corporate debt now stands just one notch above junk. In an economic decline, one should expect a disruptive wave of defaults, with far lower recovery rates than in previous economic cycles.
Now, defaults tend to be deflationary, so what you tend to see is an upward spike in the yields on junk bonds and corporate debt but a downward trend in the yields of securities viewed as being without credit risk, which has historically included Treasury securities. The question is what happens when we begin to run trillion dollar deficits.
In the event of a deflationary economic decline, even one where defaults are higher as a result of all the yield-seeking and low-grade debt issuance of recent years, another round of QE seems likely. Our response to that prospect is simple – we’ll take our cue from market internals, particularly given that the entire net total return of the S&P 500 since 2007 occurred when our measures of internals have been favorable, and most of the 2007-2009 collapse occurred when they were not. As I’ve regularly noted, our problem during the recent half-cycle had nothing to do with valuations or market internals, but with our bearish response to “overvalued, overbought, overbullish” syndromes.
Meanwhile, it’s also important to allow for an inflationary economic decline, which would result from a public loss of faith in the ability of the government to run a stable debt/GDP relationship. In that event, all bets on QE are off, and the country will just face a difficult situation, as it has periodically faced before.
The best indicator of inflation is inflation. It’s difficult to forecast inflation with macroeconomic variables, because large shifts in inflation are typically linked to discrete events that provoke a loss of confidence in price stability itself, like the trifecta of Great Society deficits, Nixon closing the gold window, and an oil embargo, or the combination of money printing and a supply shock, like using deficit finance to pay striking workers in the Ruhr. Not surprisingly, we’ll infer that shift in confidence from uniformity in the behavior of inflation-sensitive asset prices.
There’s no economic factor that predicts the rate of inflation better than the rate of inflation itself (and related uniformity in the behavior of inflation-sensitive securities including precious metals, exchange rates, bond prices, commodities, TIPS, and related securities). Just like a shift in market internals, it may be difficult to predict, but it’s fairly easy to align yourself with it.
I know that many observers are quietly repeating Milton Friedman’s phrase that “inflation is always and everywhere a monetary phenomenon.” The problem is, you won’t reliably see that in the data. As a former economics professor, I get it. The quiet job of the economics profession is to indoctrinate teenagers with purely theoretical models by showing them line-drawings. Nobody ever asks them to spend time staring at actual numbers.
So they become adults – and sometimes even Fed governors – who take theoretical diagrams as reality, for example, the notion that the Phillips curve is a relationship between unemployment and general price inflation, when there’s utterly no evidence for it. In fact, as I’ve regularly argued, when you actually look at A.W. Phillips’ data (a century of British unemployment and wage data during a period of stable general prices under the gold standard), the Phillips Curve is actually a relationship between unemployment and real wage inflation.
Of course, money creation and general price inflation are undoubtedly linked when money creation hits the pace of the Weimar Republic or Zimbabwe. But for the U.S., there’s no economic factor that predicts the rate of inflation better than the rate of inflation itself (and related uniformity in the behavior of inflation-sensitive securities including precious metals, exchange rates, bond prices, commodities, TIPS, and related securities). Just like a shift in market internals, it may be difficult to predict, but it’s fairly easy to align yourself with it. |


