EIA’s Electric Power Monthly – May 2020 Edition with data for March
by ISLANDBOY posted on 06/02/2020
a guest post by islandboy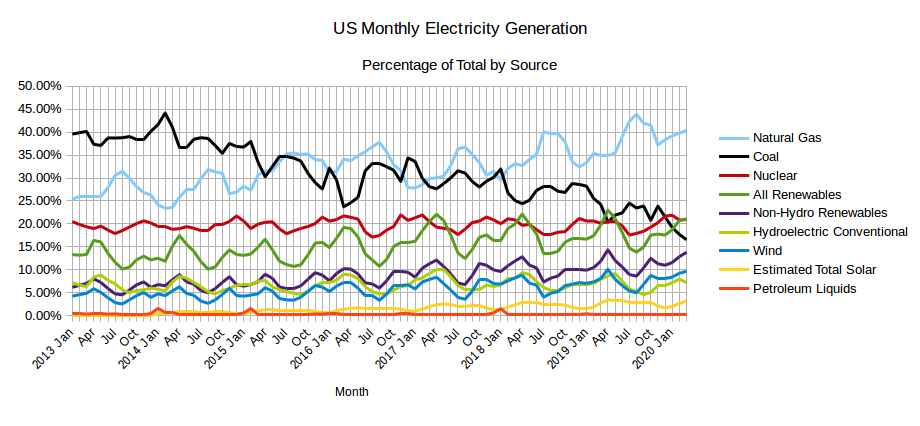
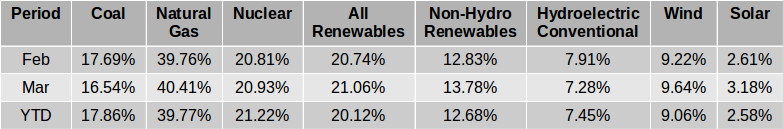
The EIA released the latest edition of their Electric Power Monthly on May 26th, with data for March 2020. The table above shows the percentage contribution of the main fuel sources to two decimal places for the last two months and the year 2020 to date.
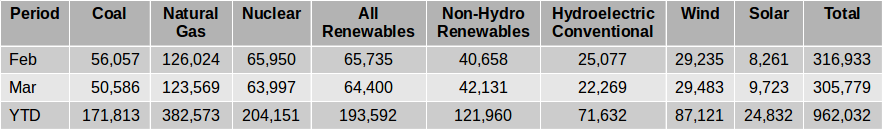
The Table immediately above shows the absolute amounts of electricity generated in gigawatt-hours by the main sources for the last two months and the year to date. In March the absolute amount of electricity generated decreased slightly, joining the years 2015 and 2016 as the only years since 2013 that did not see a slight increase in electricity production between February and March. Coal and Natural Gas between them, fueled 56.95% of US electricity generation in March. The contribution of zero carbon and carbon neutral sources increased from 41.55% in February to 41.99% in March. The percentage contribution from Natural Gas in March edged back above 40% at 40.41%, increasing from 39.76% in February.
covid-19 impactsIn March the beginning of the impact of the restrictions on US economic activity brought about in response to the COVID-19 pandemic was observed as the slight decline in production occurred despite the fact that, for example, according to the EIA’s Electricity Monthly Update:
“Florida saw electricity generation increase over 9% compared to the previous March, as the state recorded its hottest March on record.”
It is expected that the effects of the pandemic will be more clearly visible when the data for April is released on June 24, a little over three weeks from the publication of this report.
coal continues it’s precipitous fallLast month it was observed that Coal had generated less electricity than Nuclear for the third month in a row. This run has now extended for another month making it four months in a row and five months in total when April of 2019 is included. In light of the situation with the current COVID-19 lock downs and ongoing coal plant closures, it remains to be seen when coal will generate more electricity than nuclear over the course of a month.
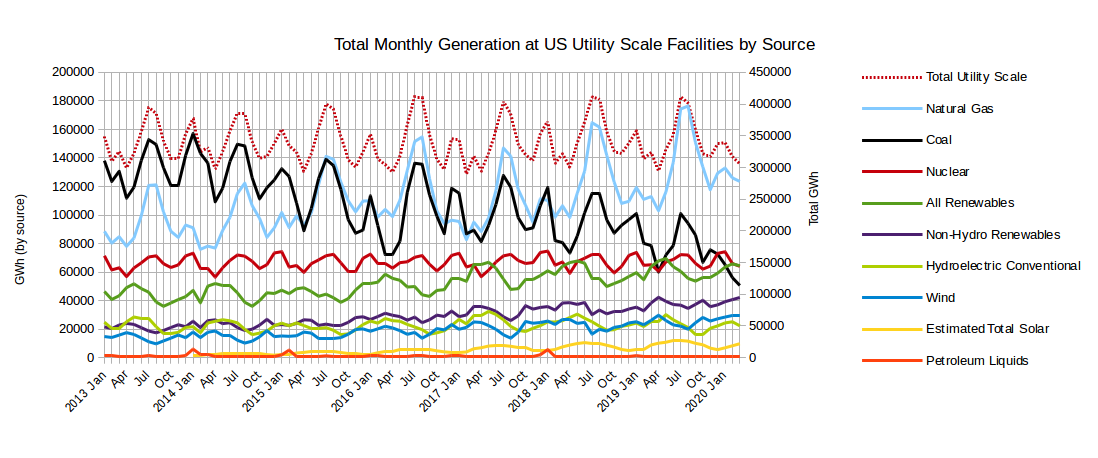
The graph below shows the absolute monthly production from the various sources since January 2013, as well as the total amount generated (right axis).
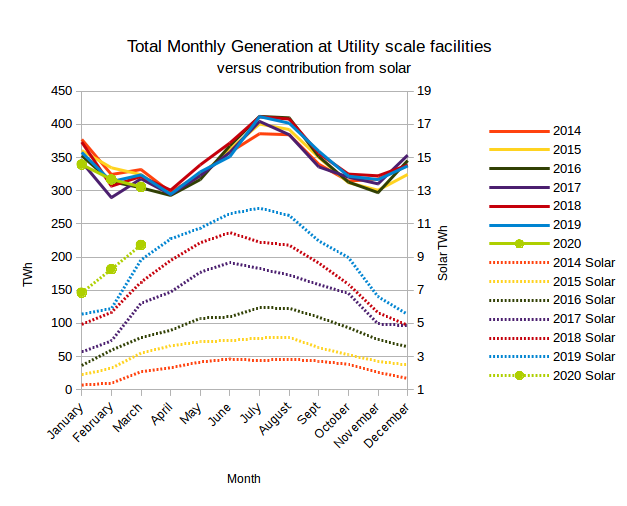
The chart below shows the total monthly generation at utility scale facilities by year versus the contribution from solar. The left hand scale is for the total generation, while the right hand scale is for solar output and has been deliberately set to exaggerate the solar output as a means of assessing it’s potential to make a meaningful contribution to the midsummer peak. In March 2020 the estimated total output from solar at 8,261 GWh, was 2.35 times what it was four years before in March 2016.
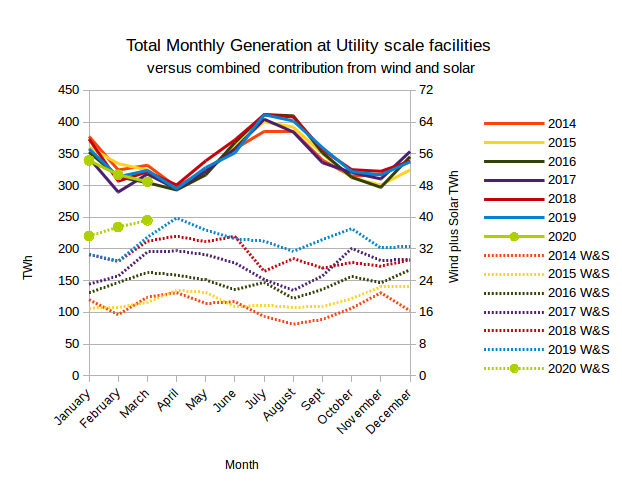
The chart below shows the total monthly generation at utility scale facilities by year versus the combined contribution from wind and solar. The left hand scale is for the total generation, while the right hand scale is for combined wind and solar output and has been deliberately set to exaggerate the combined output of solar and wind as a means of assessing the potential of the combination to make a meaningful contribution to the year round total.
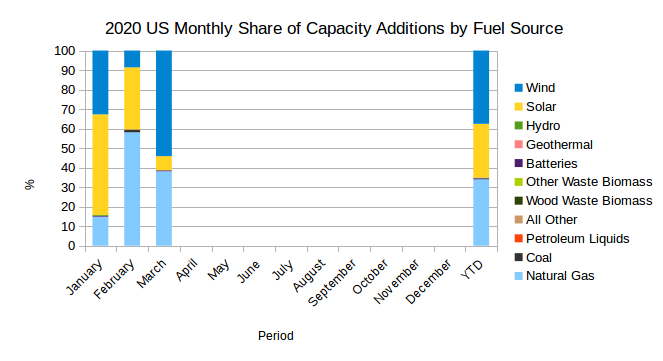
The chart below shows the monthly percentage contributions of the various sources to the capacity additions in 2020 up to March. In March Wind contributed 54.09% of new capacity, and 38.14% of new capacity came from Natural Gas, with Solar making up another 7.25% and Batteries contributing 0.51%. Natural gas and renewables continue to make up more than 95% of capacity added each month, as they have since at least January 2017.
In March 2020 the total added capacity reported was 2884.3 MW, compared to the 3913.1 MW added in March 2019.
The chart below shows the monthly percentage contributions of the various sources to the capacity retirements in 2020 up to February.
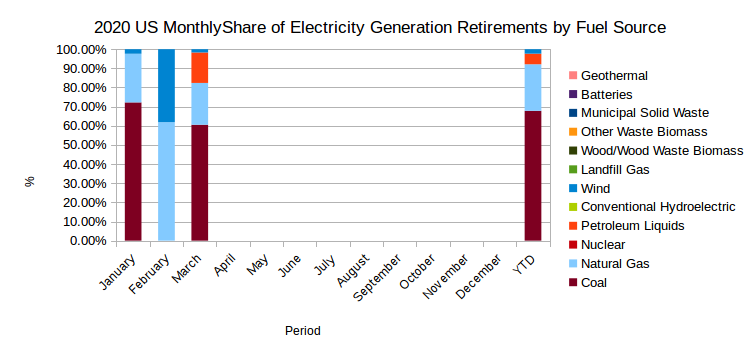
In March, Duke Energy Progress reported the retirement of 147 MW of Natural Gas fired combustion turbines and 232 MW of combustion turbines fueled with Distillate Fuel Oil at their Darlington County power plant in South Carolina. Constellation Power Source Gen reported the retirement of four Natural Gas fired combustion turbines amounting to 60.7 MW at their Notch Cliff power plant in Maryland. Sabine Cogen LP reported the retirement of a 86.7 MW Natural Gas fired combined cycle cogeneration plant at their Sabine Cogen plant in Texas. General Electric Aircraft Engines reported the retirement of 23.8 MW of Natural Gas fired steam turbines at their General Electric Aircraft Engines plant in Massachusetts. Somerset Operating Co LLC reported the retirement of their 685.9 Conventional Steam Coal, Somerset Operating Co LLC plant in New York and Empire District Electric Co reported 198 MW of Conventional Steam Coal retirement at their Asbury plant in Missouri. High Plains Wind Power LLC reported the retirement of 10 MW of Onshore Wind Turbine capacity at their High Plains facility in Texas and 15.3 MW of wind turbines were retired by Terra-Gen Operating Co-Wind at their Windland facility in California.
The 1459.4 MW total retirements reported compared to the 2321.1 MW reported in March 2019.
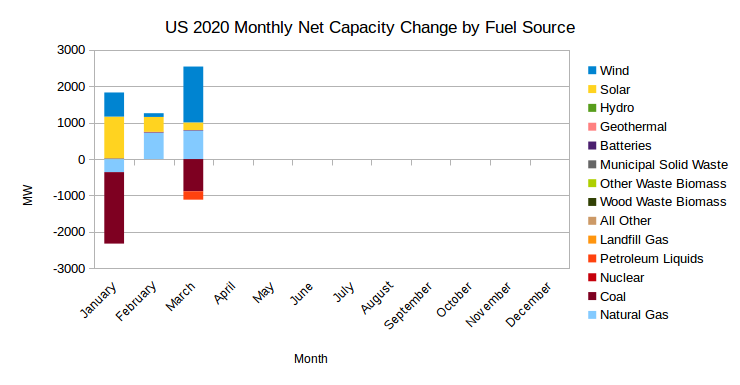
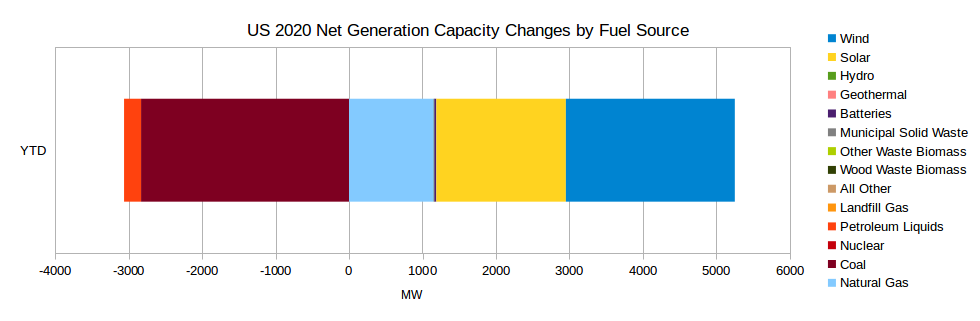
Below is a chart for monthly net additions/retirements in 2020 showing the data up to March, followed by a chart showing the net additions/retirements year to date.
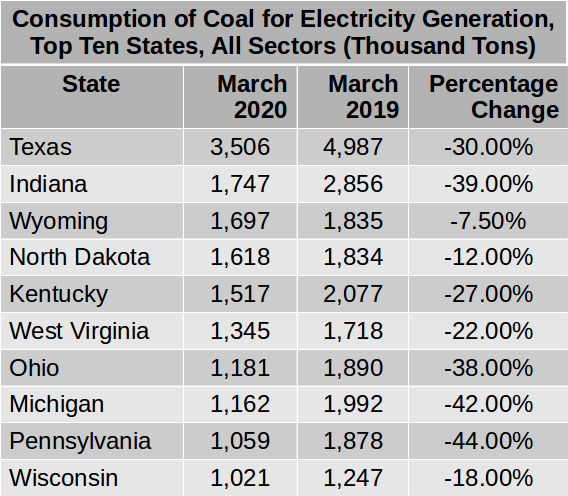
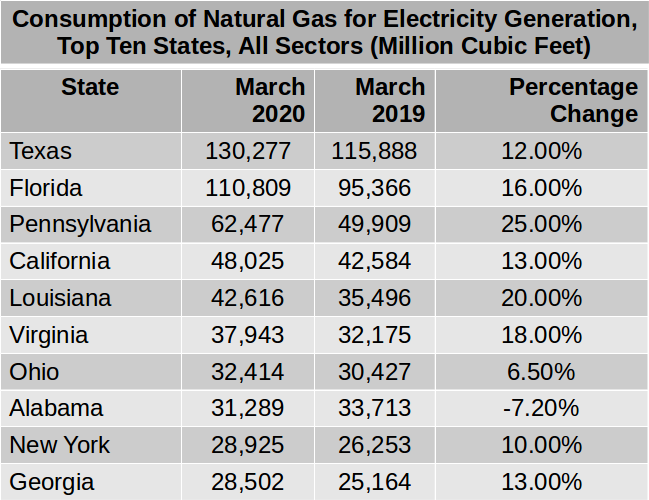
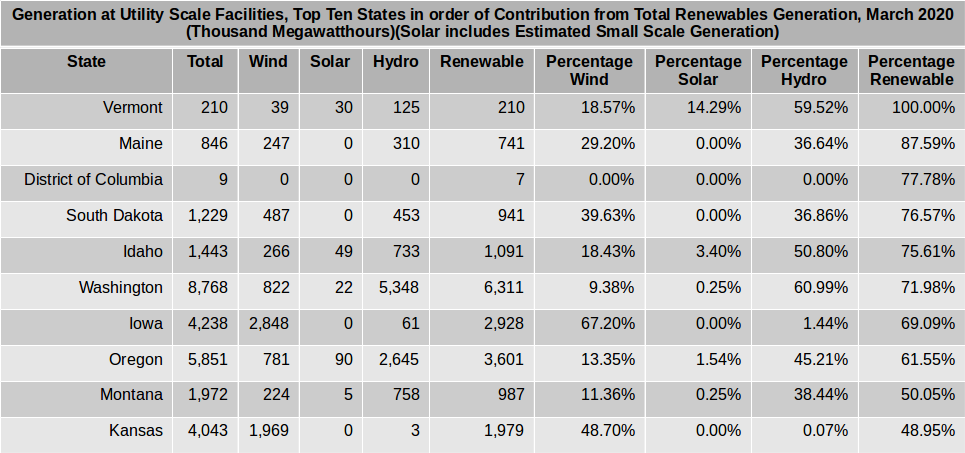
Below is a table of the top ten states in order of coal consumption for electricity production for March 2020 and the year before for comparison followed by a similar table for Natural Gas. and one for renewable energy.
In the comment section of the previous report, a reader suggested that, two new tables be included: top ten states in solar vs solar potential and top ten states in wind vs wind potential. If anyone can suggest a reliable means of quantifying the wind or solar potential of a states, that might be something that could be done but, I have not been able to figure out how one could come up with a figure for solar or wind potential for a state. I could break the table for renewables up into two or three tables, one each for solar, wind and possibly hydro. Hydro might be the least interesting since the situation with hydro is relatively stable compared to the rapid growth of wind and solar. Feedback on this is welcome.
peakoilbarrel.com |


