Regarding the chart below, ...and I apologize if I'm unable to explain myself meaningfully, and we also have to consider how both gold and silver have been making new highs in recent days, a pull back is inevitable.
A pivot point is when price action moves higher or lower to test the strength of prior days action.
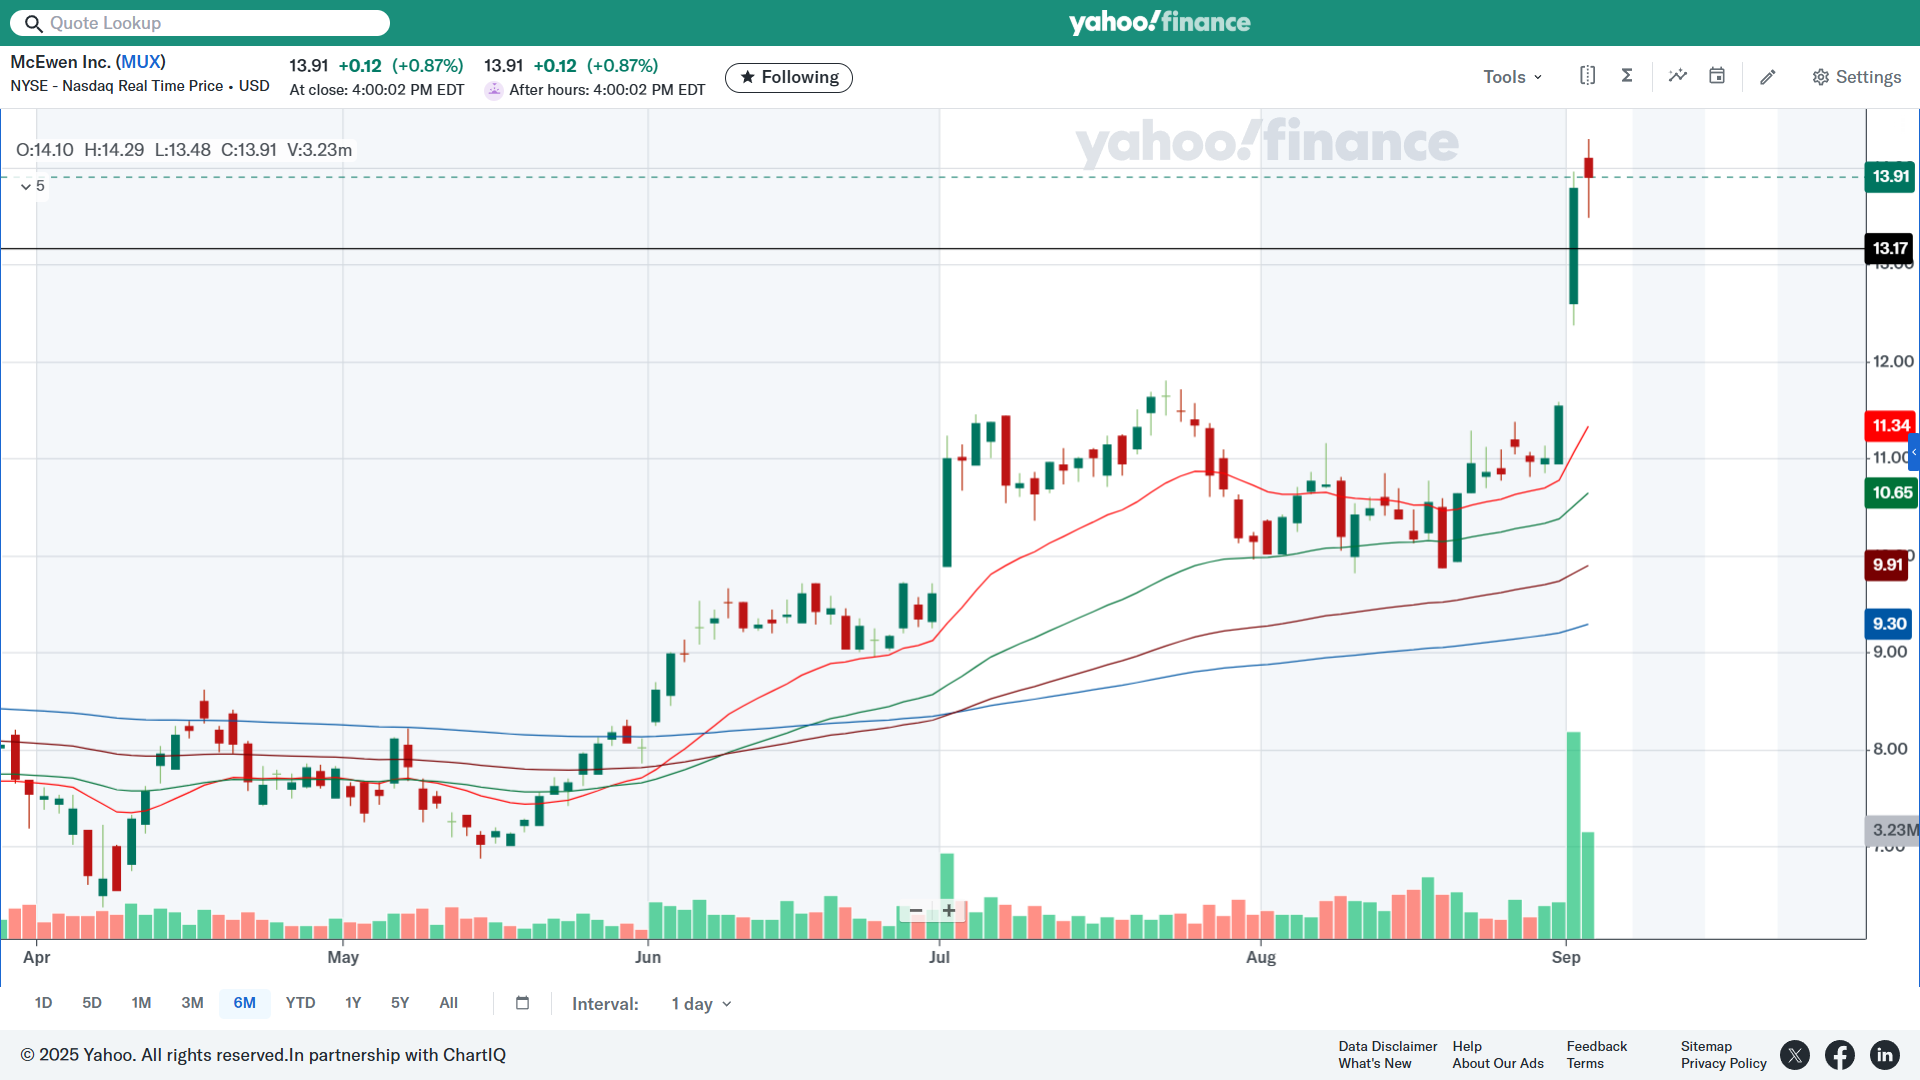
The black line at the $13.17 marks the Sep-2nd candle stick pivot point.
To calculate a pivot point price, you take the high of the day which is $13.96 and the low, which is $12.38 add them together which = $26.34, you then divide by 2 and you get the $13.17 price pivot point.
The $13.17 (give or take a couple of cents) might be a target at some point , usually the next day, especially when a stock is over bought like MUX, but it reversed today and closed in the green, so I add caution on a continuation.
A stock can drop down to fill the pivot and reverse (showing strength) and then moving back near its high.
Considering Sep-2 was a high volume day and a large % move higher, it might take a while to adjust.
A good move would be If the stock moves below the pivot and recovers quickly (same day), closing above the pivot point and/or marching higher to make new highs after an attempt or two. A base could form in and around a pivot point and build a floor.
A close below the pivot (for a few days) opens up a gap-fill. A stall at Sep-2s opening price which is $12.60 can prolong the process, but it can also build a floor above the gap, which is Beneficial as well.
|