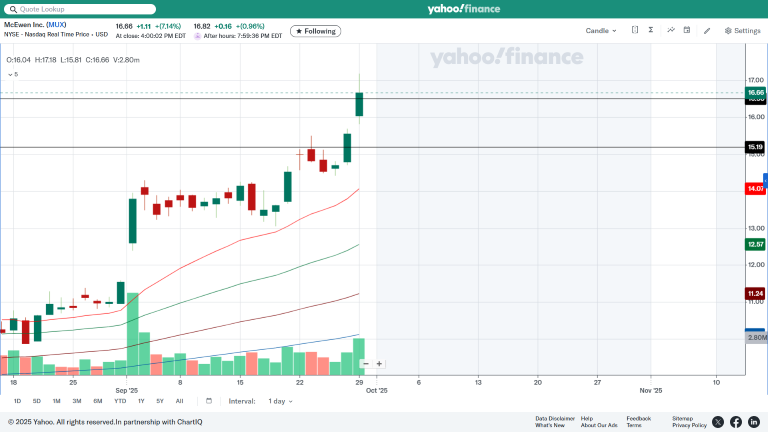
A lot can happen with MUX in the near future and the way MUX is behaving technically right now "speaks volumes", It blew right by the $16.20 and the $16.60, ...both resistance levels fell within a couple of hours of the open, very much surprised me.
I didn't expect it to move up to the $17.10/20 in one session this quickly on twice the daily volume. MUX now has a chance to move up to the $21.40/50 area at some point, which takes us back to the August, 28, 2019's high-point, but its also leaving gaps and untested pivots below both on the daily, hourly, and weekly. Cant bet against this kind of momentum.
The momentum is outstanding and its obvious the longs have taken control for now. I would like to see some consolidation for a few days and up to a couple of weeks at some point in between its new pivot points that printed in the last couple of days, the $16.50 and the $15.19 before moving yet higher.
I would not be disappointed if it moves yet higher either, seems to me the shorts have moved away from this stock for the time being, and I hope for a long, long time to come.
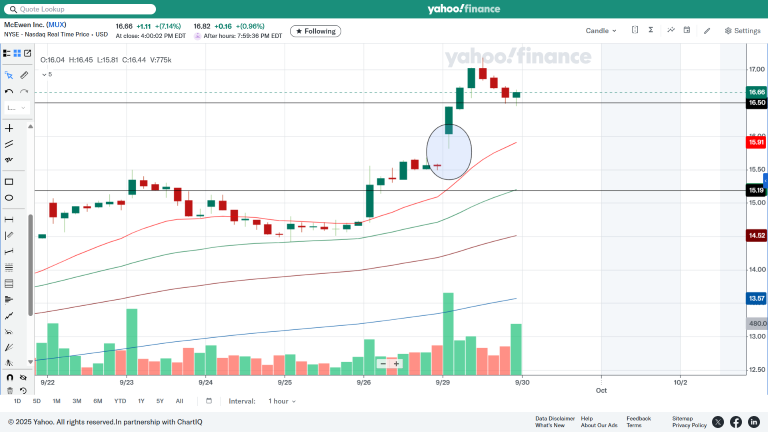
Its new pivot points at $16.50 and the $15.19 are in black on the chart below and also a new gap. Its technically becoming difficult to follow the stock due to the momentum. The pivot points prior to these new ones lasted just three days.
An hourly gap between the $15.59/81 is still open on 775k shares.
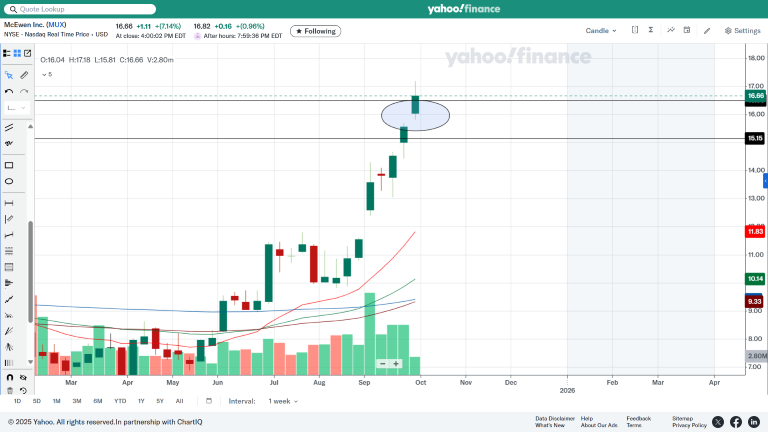
Weekly gaps are tough ones to deal with, we now have two, the black circle and the one that started it all in the first week of September with 12.4 million shares traded ...and you can see the 100 week moving average creeping up to the 200.
This last chart is the monthly chart going back to 2005/06, (where it all began), showing tremendous volume strength, its HUGE. You can also see the 20-month EMA creeping up to the 50-month, which has not happed since 10/2016.
Hopefully, ..."IF" all goes as planned, I think we can see the $49.00 area as time passes, its already climbing the wall, but we need to fill and consolidate at some points along the way so we don't have to come back later.
|


