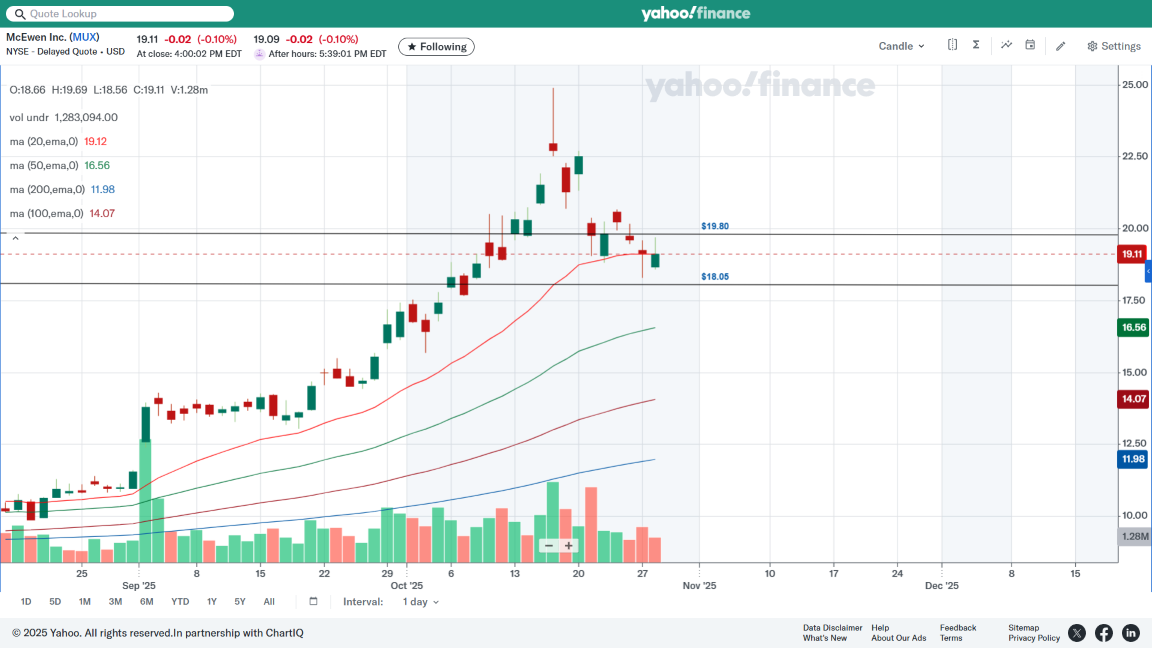
3-charts. - Monday, ...MUX closed 1¢ above the 20-day-ema. Today, Tuesday, ...MUX closed 1¢ below the 20-day ema. One has to wonder!!! Thank you to those for taking the time to read my posts and giving me Recommendation, I appreciate it.
Also, ...we almost had a bullish engulfing today, but by end of the day they took it back down below yesterdays close by 1¢. On a good note, MUX did make a higher high and a higher low and its tightly holding on to the 20-day-ema. Its still anyone's call.
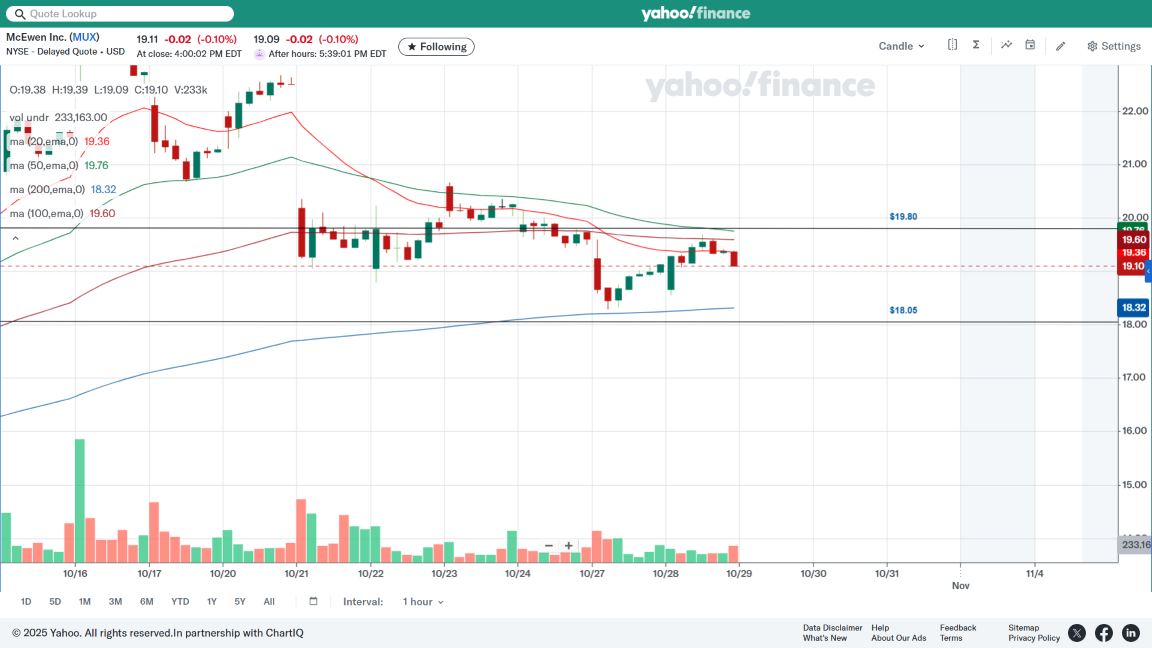
The moving averages have flipped bearish on the hourly chart, the 200-day is all that's left for support at $18.32. We can see that its been hugging the $19.80 line since 10/21/25 as volume, red & green bars, drops from 10/16/25 till now, it's testing the lower pivot at $18.05 while its pretty much going sideways in between the 2 pivot points. Selling volume could be slowing.
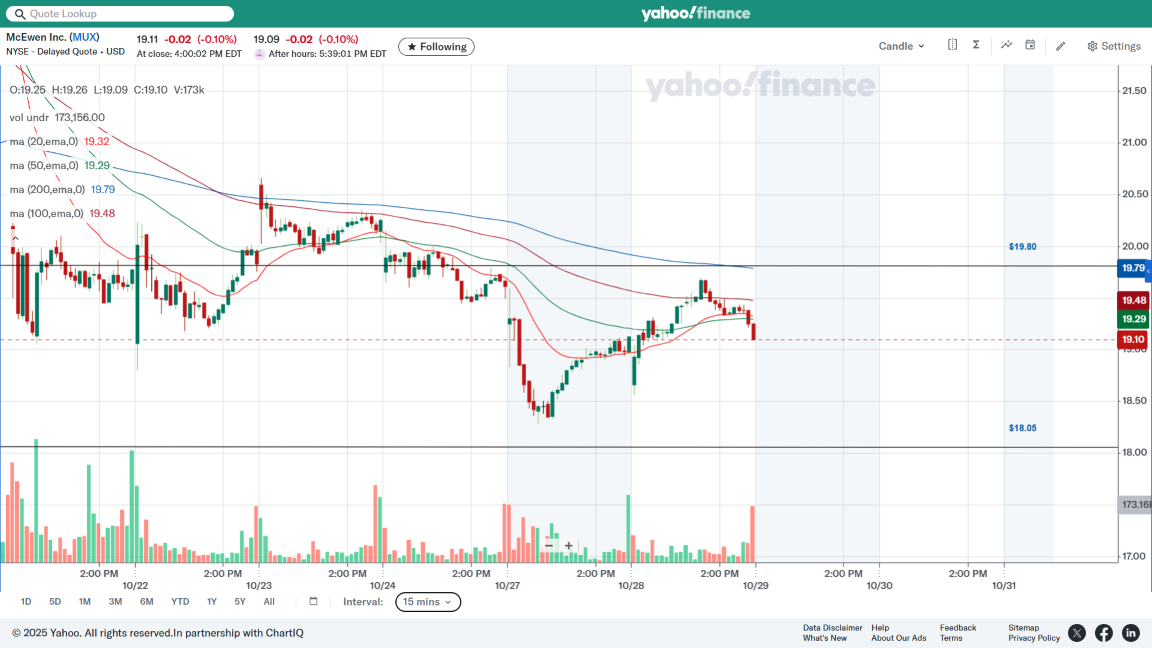
In this 15-minute chart, selling pressure was heavy in the first hour on Monday morning, (10/27/25). Around noon, you can see a black neutral DOJI (like this + ), notice the buyers stepping in as the bars turned green from red, even though the volume favored the sellers that day, it recovered the 20-day-ema. Also notice in the last half hour of trading, sellers traded 60K & 173K in those two 15 minute time frames, it took away the bullish engulfing I mentioned in the daily chart. Like I said, ...One Has To Wonder!!! "I would love to see a short squeeze soon"
|