Some Minority Chances of Acceptance to Med School Almost 10 Times Higher Than White/Asian.
By Mark J. Perry
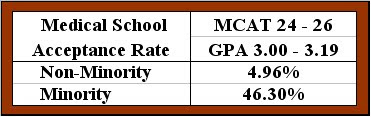
Data are now available from the Association of American Medical Colleges (AAMC) on acceptance rates at medical schools for all students (data here) and acceptance rates for minority students (Hispanic, Black or Native American, data here), by MCAT and GPA, for the years 2007-2009 aggregated. From those data, I was able to create the table above for the acceptance rates for non-minorities (I'm assuming white and Asian), and compare to the acceptance rates for minorities, for those applicants with an MCAT score of 24-26 and a GPA between 3.00 and 3.19. In the past, the AAMC used to list whites, Asians, blacks, Hispanics and Native Americans separately, but it now only provides data for two categories: all applicants and minorities, so I had to do the calculation myself to determine the non-minority acceptance rate.
Perhaps the AAMC wishes to make the comparisons of acceptance rates by ethic groups harder, because the results above are pretty dramatic, and maybe this is what it is trying to hide? This just one example: for those applicants with a MCAT of 24-26 and GPA of 3.00-3.19, fewer than one out of 20 non-minorities will be accepted, while almost one out of two minorities will be admitted.
I'll do more analysis on this in a few days when I get some more time, just wanted to share some preliminary results. |


