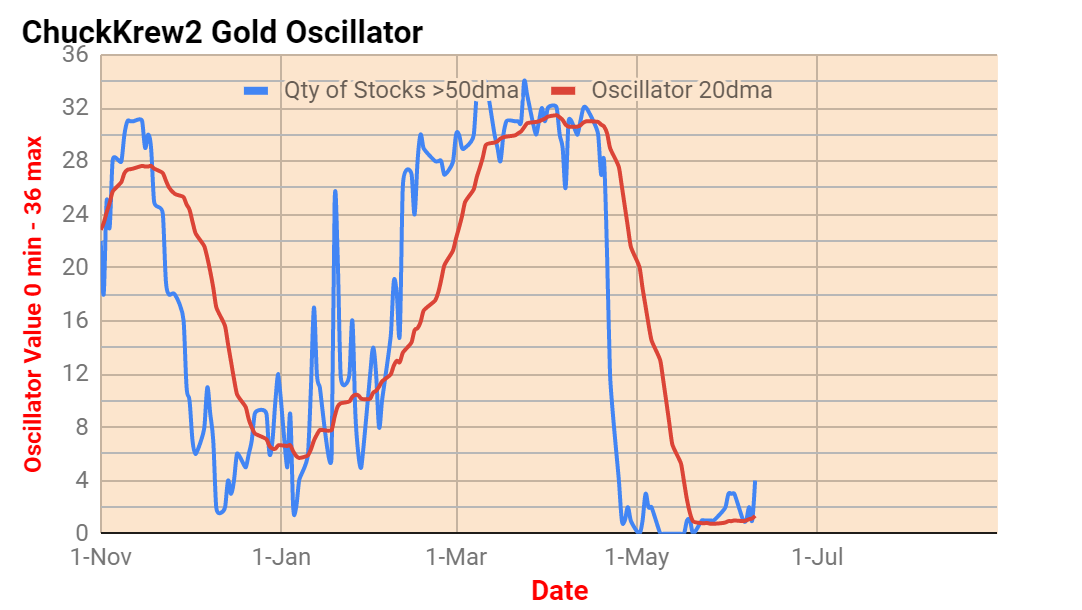
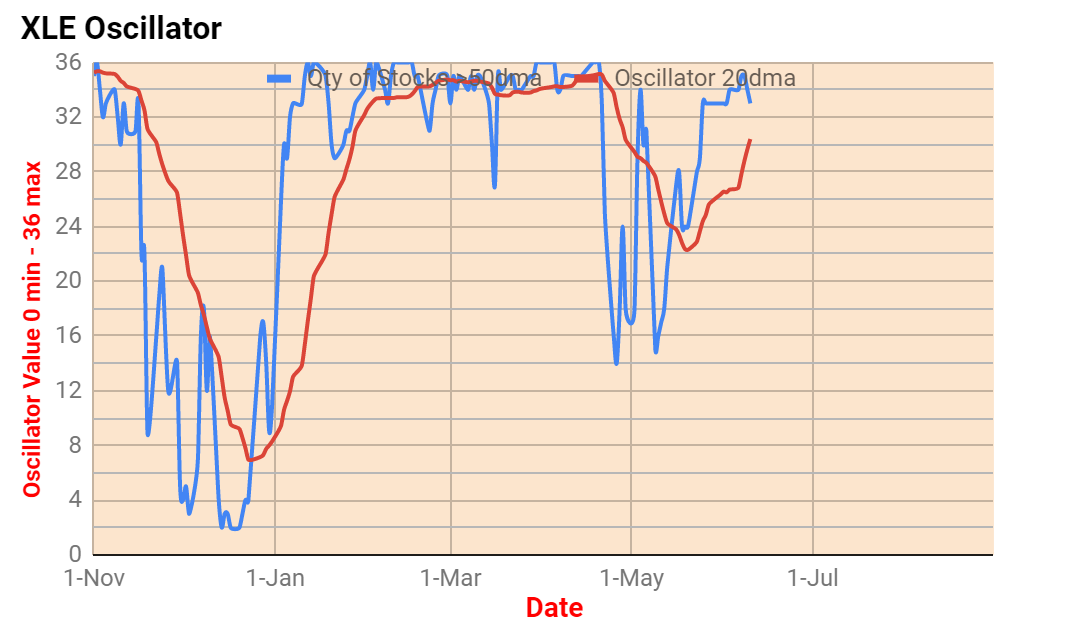
| Each day after market close the database is updated and scanned to determine how |
| many of the stocks are above their 50 day simple moving average. Each day's answer |
| is used to recalculate a 20 day simple moving average for the tally of stocks closing |
| above their 50 day simple moving average. That is the red line you see on the chart. |
| When the red line gets over 9 and starts up again, I use it as a low risk intermediate |
| term entry point into gold stocks that I like. When the red line gets over 26, I become |
| cautious and start thinking whether to sell out, sell calls, or do nothing. |
| . |
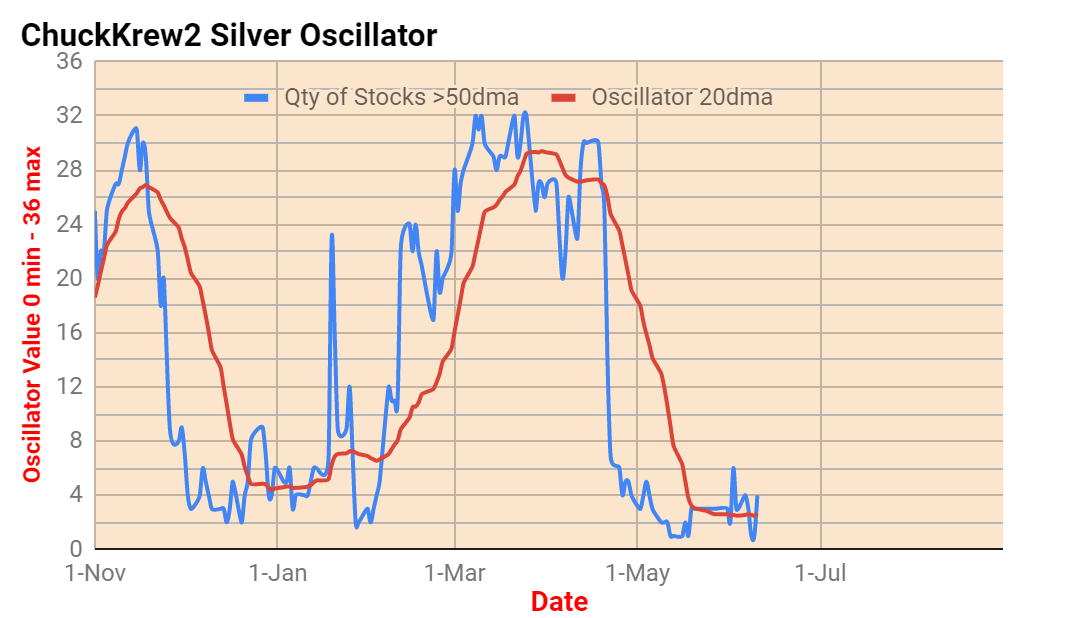
| The theory is that it takes a lot of selling to put at least 26 stocks of a 36 stock database |
| from the same sector under their 50 day simple moving average and keep them there |
| long enough for a 20 day simple moving average to drop below 9 and a lot of buying |
| for it then to rise up to 26 on the same 20 day basis It's purely sentiment, a measure |
| of fear and greed. Strangely, the most difficult thing to do is buy when the sentiment is |
| low, even though history shows time and again that the selling will stop soon. For me |
| the key is: be sure the sector is in a bull market and wait for that 20 day simple moving |
| average to start back up. That means that many of the stocks have stopped falling. |
| . |
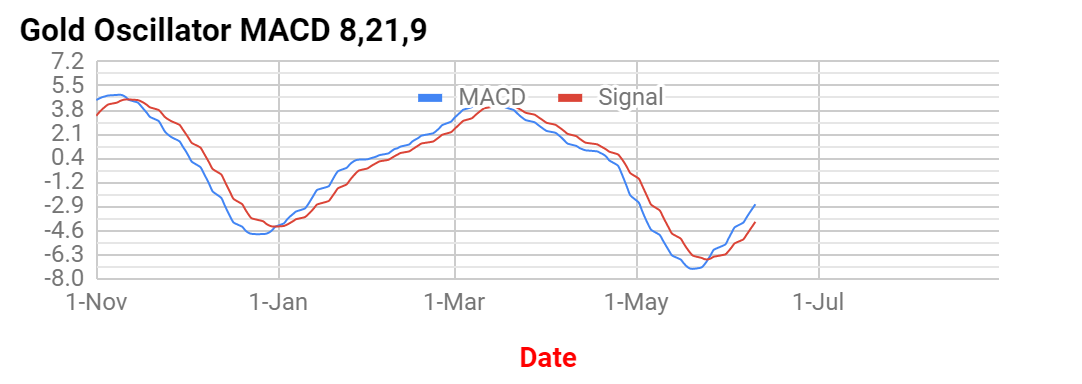
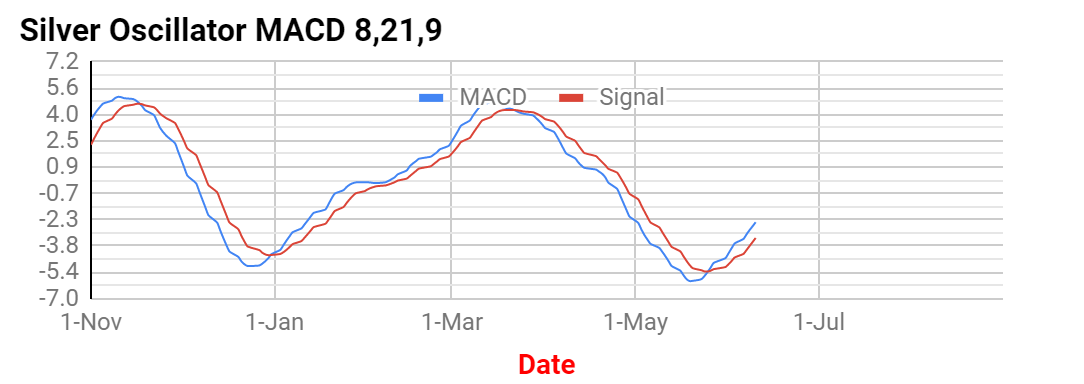
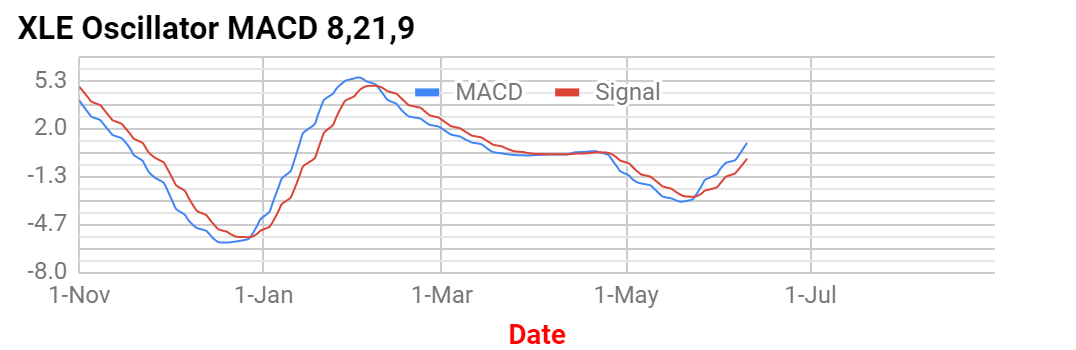
| No indicator is foolproof. This one is no different and should be used in conjunction |
| with other indicators like MACD, RSI, and Stochs combined with some common sense. |
.