From weatherguru:
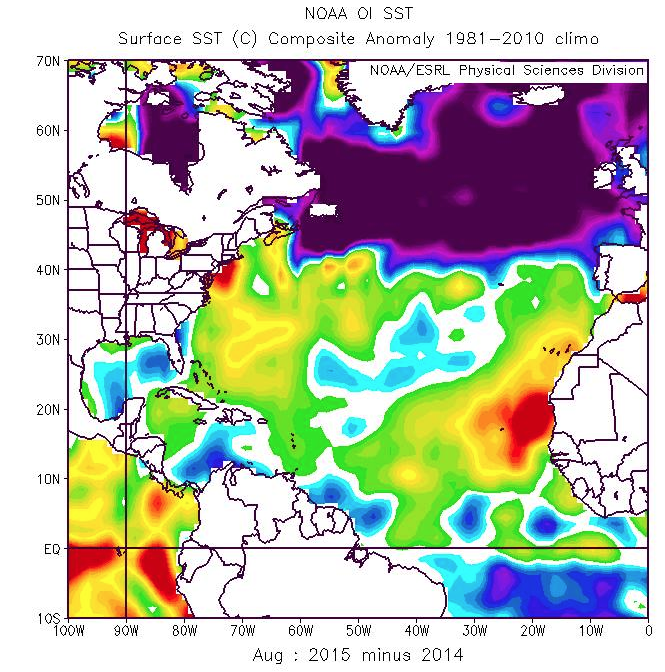
From Sep 1, 2014 to Aug 31, 2015...Greenland accumulated 200 Gtons of snow. It's gained 100 Gtons this past month alone. That's +300 GTons in the last 13 months. Thus, there was no melting in Greenland when North Atlantic SST's dropped 2 degrees in the past year.
This natural cycle is tied to the pressure the solar wind exerts on top of the atmosphere (impacts the polar jet in the stratosphere). This changes the major phases of boreal circulation known as the Arctic Oscillation (a.k.a. the North Atlantic Oscillation). Here is one famous peer-reviewed article showing this link of stratosphere to troposphere.
sciencemag.org
The pattern shifted in 2005 as the sun as heading toward solar minimum. Since 2005, Atlantic tropical activity has plummeted. The shift in the North Atlantic Current has been going on for nearly a decade.

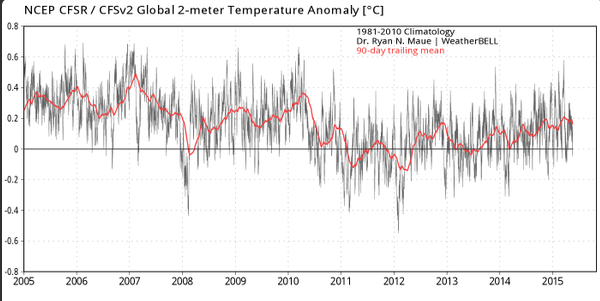
If you look at annual average of Arctic sea ice the past 9 years, it shows something different than what the media is pumping. Of course, I'll be the first to say the Earth is warmer now than in the late 1970's, and Arctic sea-ice is much lower now than in the late 1970's. But this is not a downward spiral. It is stabilizing and increasing. It's all part of the natural cycle that has been see-saw-ing for centuries.

The only dataset that says the Earth hasn't been cooling since 2006 is NOAA/NCAR's fabricated dataset, which the same data also used by NASA/GSFC and the Japan and Australia Bureau of Meteorology. Otherwise, satellites say we are cooling. Sea ice confirms that. I could also show global temperatures from initialized weather models over the past decade; that also shows cooling.
The Pacific Blob is, IMO, a result of the "polar vortex" pattern. It's extratropical, so the blob doesn't impact # of tropical systems. That's on El Nino. The contrast between a cold Atlantic and warm Pacific lead to a lot of rainfall in U.S. in May. That was from a really strong jet stream, which is the antithesis of global warming. |


