4 New Papers: Modern Warming Is Substantially Artificial, Traced To Urbanization, Bias
By Kenneth Richard on 24. July 2017
Scientists: Temperature Data ContaminationAccounts For 33% – 75% Of Modern WarmingUrban heat from paved roads, buildings, and machinery can artificially inflate temperatures substantially above measured temperatures from non-urban areas. This introduces a significant non-climatic warming bias into long-term records.
Heat from an urban (or highly populated) environment can artificially raise temperatures by as much as 3°C to 10°C relative to nearby rural locations. This is true even for villages in the Arctic.
Imhoff et al., 2010 On a yearly average, urban areas are substantially warmer than the non-urban fringe by 2.9°C Konstantinov et al., 2015 This article presents the results of a study of the urban heat island (UHI) in the city of Apatity [Russian Arctic] during winter that were obtained according to the data of field meteorological measurements and satellite images. Calculations of the surface layer temperature have been made based on the surface temperature data obtained from satellite images. … As a result of the analysis of temperature fields, an intensive heat island (up to 3.2°C) has been identified Kim, 1992 The results indicate that urban heating is attributable to a large excess in heat from the rapidly heating urban surfaces consisting of buildings, asphalt, bare-soil and short grasses. In summer, the symptoms of diurnal heating begin to appear by mid-morning and can be about 10°C warmer than nearby woodlands.Artificial Warming From Urban Bias A ‘Substantial Portion’ Of Overall Global Trend
Scientists were at one time concerned that artificial warming biases from expanding urbanization might contaminate the measured surface temperature record.
As recently as the late 1980s it was concluded that the “artificial warming” from urban heat could add an extraneous 0.1°C to 0.4°C of warming per decade in some regions, and that the non-climatic warming attributed to urbanization exceeds the observed overall long-term trends after the 1950s. In other words, a substantial portion of the warming since the mid-20th century could be attributed to artificial heat.
Karl and Quayle, 1988 Karl et al., 1988) has shown that at some ‘sun belt’ cities in the West, the rise of temperature that can be attributed to the urban heat island is as much as 0.3 to 0.4°C per decade. In the East, the rise is over 0.1°C per decade. … The artificial warming in the primary station network, relative to the climate division data, is nearly 0.17°C over the past 34 years [1950s]. Such trends are at least as large as any of the observed trends over the United States (Karl, 1988) or the globe (Jones and Wigley, 1987). Karl and Jones, 1989 Results indicate that in the United States the two global land-based temperature data sets have an urban bias between +0.1°C and +0.4°C over the twentieth century (1901-84). … The magnitude of this urban bias in two global, land-based data sets was found to be a substantial portion of the overall trend of global and regional temperatures.Modern Temps Rising 0.05°C – 0.12°C/Decade…Urban Heat Bias Rising Faster
The IPCC considers the year 1750 as the starting point for the radiative anthropogenic influence on climate, due principally to fossil fuel burning and concomitant CO2 emissions. Since 1850, CO2 concentrations have risen from 285 ppm to 400 ppm. During these ~165 years, the IPCC has concluded that surface temperatures have warmed by 0.78°C. This is a warming rate of only 0.05°C per decade for 1850-2012 — which happens to be the same rate of warming over the 1998-2012 period. Temperatures are rising at a rate of 0.12°C per decade during 1951-2012.
IPCC AR5 (2013) : The globally averaged combined land and ocean surface temperature data as calculated by a linear trend, show a warming of 0.85°C over the period 1880 to 2012, when multiple independently produced datasets exist. The total increase between the average of the 1850–1900 period and the 2003–2012 period is 0.78 °C, based on the single longest dataset available 4 (see Figure SPM.1). … [T]he rate of warming over the past 15 years (1998–2012; 0.05 °C per decade), which begins with a strong El Niño, is smaller than the rate calculated since 1951 (1951–2012; 0.12 °C per decade).As suggested above, (a) non-climatic urban heating may artificially add 0.1°C per decade (or more) to the temperature record; (b) the overall surface temperature record is only rising at a rate of +0.05°C to +0.12°C per decade; therefore, (c) this would imply that all or nearly all the warming since 1850 or 1950 may be attributed to rapidly expanding urbanization and measurement bias, not climate change.
4 New Papers Highlight Artificial Warming Bias, Adjustments
Four new studies can be added to a large collection of scientific papers documenting an accelerating artificial warming bias.
1. Urbanization Adds +0.13°C Per Decade To Temp Record
Liao et al., 2017 We examine the urban effect on surface warming in Eastern China, where a substantial portion of the land area has undergone rapid urbanization in the last few decades. Daily surface air temperature records during the period 1971–2010 at 277 meteorological stations are used to investigate temperature changes. Owing to urban expansion, some of the stations formerly located in rural areas are becoming increasingly influenced by urban environments. To estimate the effect of this urbanization on observed surface warming, the stations are dynamically classified into urban and rural types based on the land use data for four periods, i.e. 1980, 1990, 2000 and 2010. After eliminating the temperature trend bias induced by time-varying latitudinal distributions of urban and rural stations, the estimated urban-induced trends in the daily minimum and mean temperature are 0.167 and 0.085?°C?decade-1, accounting for 33.6 and 22.4% of total surface warming, respectively. The temperature difference between urban and rural stations indicates that urban heat island intensity has dramatically increased owing to rapid urbanization, and is highly correlated with the difference in fractional coverage of artificial surfaces between these two types of stations. This study highlights the importance of dynamic station classification in estimating the contribution of urbanization to long-term surface warming over large areas.2. ‘Very Likely’ GISS Artificial Warming Bias Of 0.65°C/Century (Globe)
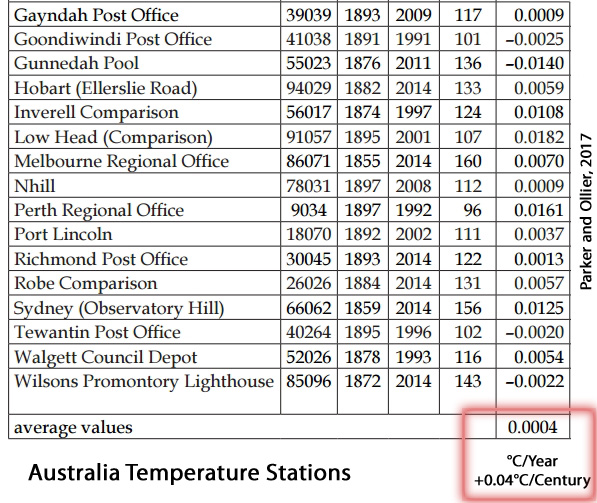
Parker and Ollier, 2017 The global reconstructions as GISS (Hansen et al. 2010, GISTEMP Team 2017) are artificially biased upwards to reproduce the carbon dioxide emission trend, but the strong natural oscillation signal prevails. The very likely overrated warming rate since 1880 is 0.00654°C/year or 0.654°C/century. This rate increases to 0.00851°C/year or 0.851°C/century by considering the data only since 1910. The warming rate cleared of the oscillations is about constant since the 1940s.As there is no way to perform a better measurement going back in the past, there is no legitimate way to correct recorded data of the past. Therefore, we should stick to the raw data.2. Australia Has ‘Warmed’ By 0.04°C Since 1800s…BOM Artificially Inflated Temps
Parker and Ollier, 2017 (Continued) Table 1 presents the warming trend for the 30 longest temperature records of Australia collected in a single location, with measurements started before 1900 and continued until after 1985. … In the 30 locations, the monthly mean maximum temperature is warming 0.0004°C/year, or 0.04°C/century. That means there is no change within the limits of accuracy of the measurements.
A definitive statement about the BOM procedure is provided by Parker (2016). The Global Historical Climatology Network (GHCN) v2 temperature time series (GISS Surface Temperature Analysis, 2012) in Alice Spring and all the 36 other stations located in a circle of 1,000 km from Alice Springs do not show any warming.
There are stations covering different time windows having very close patterns of temperatures. In this circle of 3,141,593 km2 (roughly 50% of Australia) that is mostly underdeveloped, none of the stations […] actually has a warming trend. … It is therefore only an artefact by BOM to produce the warming. Homogenization is supposed to be used to account for upwards biases such as Urban Heat Island, not to introduce upwards biases.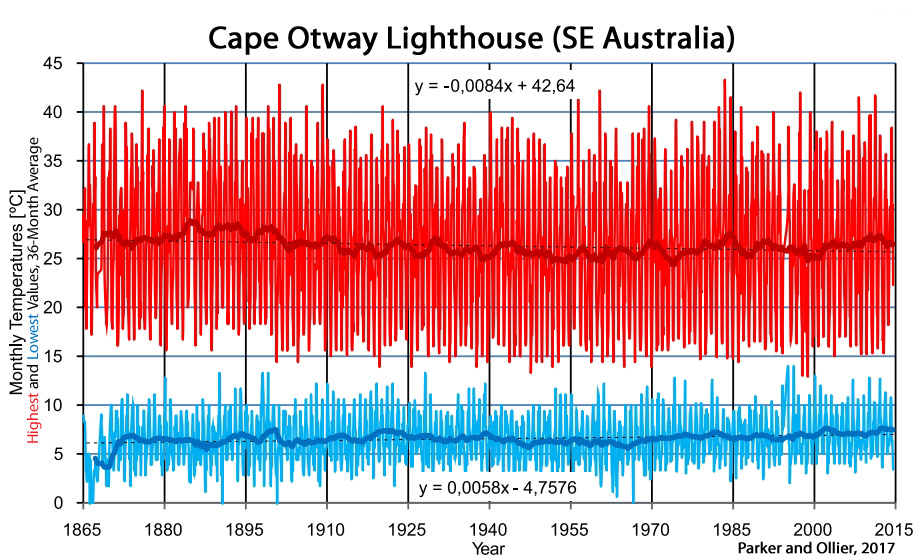
As noticed by Parker (2015a), the ACORN adjustments of Australian temperatures are in the wrong direction, inevitably in the direction to produce a warming much larger than the legitimate. In the centre of Australia, all the stations available in a circle of radius 1,000 km were showing very little or no warming, as still acknowledged in the GHCN v2 data set up to October 2011 (Fig. 6). To move from a scattered population of stations with unequal time coverage and many missing data but both uniformly not warming to produce the largest warming trend for Australia as depicted by the BOM it only requires many administrative corrections and the development of an ad-hoc procedure to compute spatial trends.We should also consider the role of the Bureau of Meteorology. The climate trend maps compiled by Bureau of Meteorology in their climate change section are completely unreliable, as the alleged increasing temperature is obtained by lowering temperatures of the past by “adjustments”.The longest of the Australian temperature records that were considered the most reliable by Bureau of Meteorology on February 2009 (BOM 2009) are still available as raw temperatures in the climate data online section and consistently show no warming and no increased extreme events within the limit of accuracy of measurements.3. Moving Stations, ‘Adjustment’ Bias Adds +0.47°C? To Temp Record Since 1800s
Dienst et al., 2017 We here assess these influences and demonstrate that even in villages urban heat island biases might affect the temperature readings. … Due to the station movement from the village centre to the outskirts, the net correction results in an additional warming trend over the past 155?years. The trend increase is most substantial for minimum temperatures (+0.03?°C?/10?years-1) [+0.47°C over 155 years] . … An increase in trend is even more severe if the 20th century is regarded exclusively, displaying a rise in annual mean temperature trend by +0.03?°C /10?years-1 and +0.07?°C?/10?years-1 in annual minimum temperatures, respectively. … The adjustment of the Haparanda station record results in an increased warming trend.4. Rapidly Increasing Urbanization To Add 2.4°C To Temps By 2100
Levermore et al., 2017 The urban heat island intensity in Manchester has a highly significant rising trend which by the end of the century could add 2.4 K to the average annual urban temperature, on top of the predicted climate change increase. An analysis of the urban morphology showed that the urban site had indeed become more urban over 9 years of the study, losing green spaces which mitigate against the UHII [urban heat island intensity].Below are several more scientific papers supporting the conclusion that a substantial portion of modern warming can be traced to urbanization, bias, and measurement contamination.
‘Data Contamination’ Accounts For ~50% Of Warming During 1980-2002
McKitrick and Michaels, 2007 [E]xtraneous (nonclimatic) signals contaminate gridded climate data. The patterns of contamination are detectable in both rich and poor countries and are relatively stronger in countries where real income is growing. We apply a battery of model specification tests to rule out spurious correlations and endogeneity bias. We conclude that the data contamination likely leads to an overstatement of actual trends over land. Using the regression model to filter the extraneous, nonclimatic effects reduces the estimated 1980–2002 global average temperature trend over land by about half.Urbanization Accounts For 65-80% Of Warming Trend Since 1960s
Ren et al., 2007 The annual urban warming at the city stations can account for about 65~80% of the overall warming in 1961~2000, and about 40~61% of the overall warming in 1981~2000.Urbanization Adds 0.2 °C/Decade, Half Of Athens’ Warming Since 1970
Founda et al., 2015 Highlights: UHI [the Urban Heat Island effect] accounts for almost half of Athens’ warming.The study explores the interdecadal and seasonal variability of the urban heat island (UHI) intensity in the city of Athens. Daily air temperature data from a set of urban and surrounding non urban stations over the period 1970–2004 were used. Nighttime and daytime heat island revealed different characteristics as regards the mean amplitude, seasonal variability and temporal variation and trends. The difference of the annual mean air temperature between urban and rural stations exhibited a progressive statistically significant increase over the studied period, with rates equal to +0.2 °C/decade. A gradual and constant increase of the daytime UHI intensity was detected, in contrast to the nighttime UHI intensity which increases only in summer, after the mid 1980s.A+217 to +562% Artificial Warming Detected In Western U.S. Due To ‘Artifacts’
Oyler et al., 2015 Artificial Amplification of Warming Trends …Western United States Observations from the main mountain climate station network in the western United States (US) suggest that higher elevations are warming faster than lower elevations. This has led to the assumption that elevation-dependent warming is prevalent throughout the region with impacts to water resources and ecosystem services. Here, we critically evaluate this network’s temperature observations and show that extreme warming observed at higher elevations is the result of systematic artifacts and not climatic conditions. With artifacts removed, the network’s 1991–2012 minimum temperature trend decreases from +1.16?°C decade-1 to +0.106?°C decade-1 and is statistically indistinguishable from lower elevation trends. Moreover, longer-term widely used gridded climate products propagate the spurious temperature trend, thereby amplifying 1981–2012 western US elevation-dependent warming by +217 to +562%. In the context of a warming climate, this artificial amplification of mountain climate trends has likely compromised our ability to accurately attribute climate change impacts across the mountainous western US.‘Half Or More’ Of Recent Warming Due To Urban Growth
Hughs and Balling, 1996 The long-term mean annual temperature record (1885 –1993) shows warming over the past century, with much of the warming occurring in the most recent three decades. However, our analyses show that half or more of this recent warming may be related to urban growth, and not to any widespread regional temperature increase.24% – 44% Of Overall Warming Due To Urbanization
Yang et al., 2011 [R]apid urbanization has a significant influence on surface warming over east China. Overall, UHI [urban heat island] effects contribute 24.2% to regional average warming trends. The strongest effect of urbanization on annual mean surface air temperature trends occurs over the metropolis and large city stations, with corresponding contributions of about 44% and 35% to total warming, respectively. The UHI trends are 0.398°C and 0.26°C decade-1. The most substantial UHI effect occurred after the early 2000s, implying a significant effect of rapid urbanization on surface air temperature change during this period.Long-Term New Zealand-Wide Temps Artificially Inflated By Factor Of 3
de Freitas et al., 2015 New Zealand’s national record for the period 1909 to 2009 is analysed and the data homogenized. Current New Zealand century-long climatology based on 1981 methods produces a trend of 0.91 °C per century. Our analysis, which uses updated measurement techniques and corrects for shelter-contaminated data, produces a trend of 0.28 °C per century.
13http://notrickszone.com/2017/07/24/modern-warming-is-substantially-artificial-traced-to-urbanization-bias/#sthash.KPYH7moJ.dpbs
Colorado Wellington 24. July 2017 at 5:10 PM | Permalink | Reply
The temperatures in the countryside are not natural. The forests, meadows, lakes, ponds, streams and marches are artificially cooling the environment but such features don’t exist in our cities and metropolitan areas. I would not report them at all but if you must, of course they should be adjusted upwards to conform to the representative temperatures measured in densely populated urban areas.
(sarc) |
|


