Annual Benchmark Payroll Revisions: Nonfarm Job Creation for 12 Months to March Chopped by 911,000, to 1.44 Million Jobs Created
by Wolf Richter • Sep 9, 2025 • 22 Comments
Based on employers’ quarterly payroll filings. Why wait so long for revisions? Do it quarterly!
By Wolf Richter for WOLF STREET.
Every month, the Bureau of Labor Statistics asks 10s of thousands of employment locations about their payrolls as part of its Current Employment Statistics (CES). It then uses the data, plus a model for estimating the employment effects of firms having shut down (“deaths”) and firms having been created (“births”) during the period, to estimate the nonfarm payrolls for that month, whose month-to-month changes become market fodder. These preliminary data are then revised several times in the following months as more data become available, sometimes with stunning results.
Separately, all employers file payroll tax reports with their state agencies that become part of the unemployment insurance tax records. This is administrative data, not survey data. These detailed payroll data then become the primary input for the BLS’s Quarterly Census of Employment and Wages (QCEW).
But given the delay in these filings and the quarterly nature of the QCEW, these data are useless for monthly reporting and would not satisfy our hunger for monthly data – which is why the survey-based estimates from the CES are released monthly.
The BLS then adjusts (“benchmarks”) the monthly survey estimates of the CES to the actual payroll data in the quarterly QCEW for the 12 months through March.
Today, the BLS released the preliminary benchmark payroll revisions for the total 12-month period through March 2025. Then in February 2026, it will release the final benchmark revisions spread across the months.
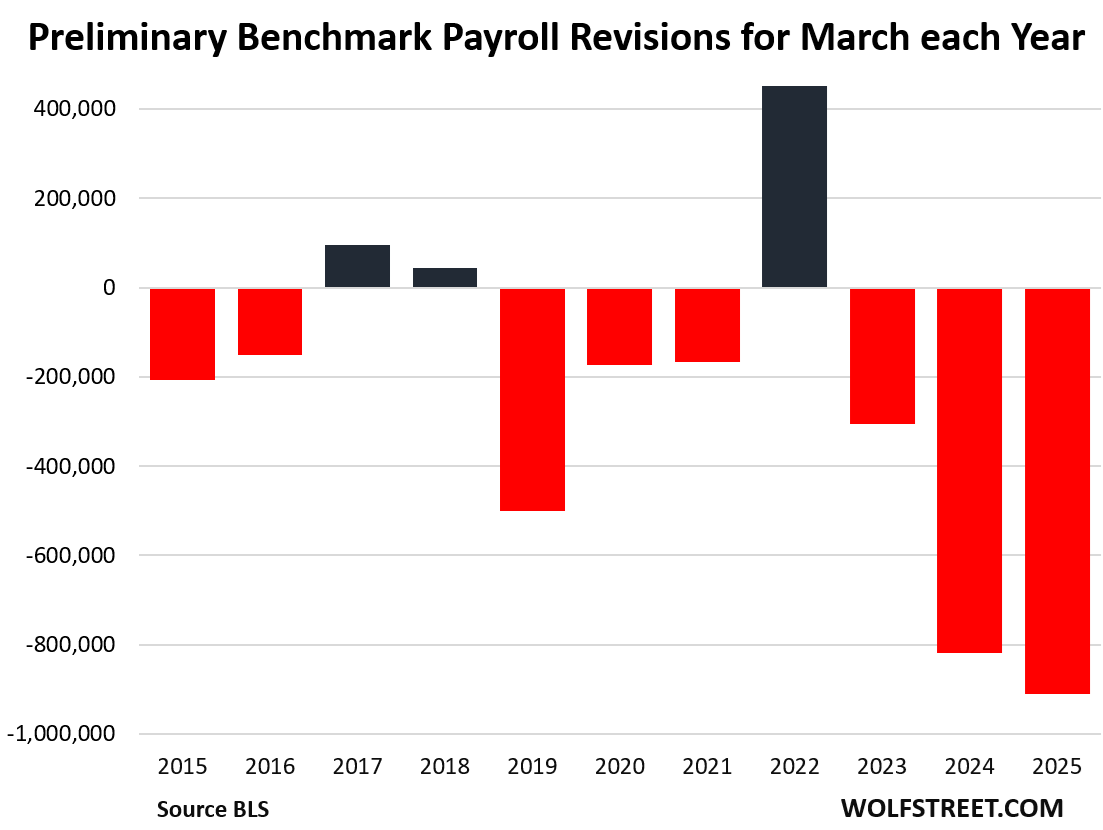
The BLS today downwardly revised by 911,000 jobs, or by 0.6%, the number of nonfarm jobs in the period through March 2025.
Private sector jobs were revised down by 880,000 jobs; government jobs were revised down by 31,000.
Based on the monthly survey data, the BLS estimated job growth at 2.35 million jobs over the 12-month period through March, or an average of 196,000 per month.
Today’s revision lowered the pace of job growth to 1.44 million jobs over the 12-month period through March, or an average of 120,000 per month.
Where did this massive overestimation by the monthly survey data come from? The BLS said that “preliminary research” indicates two primary contributors:
- Response error: Businesses reported less employment to the QCEW than they reported to the CES survey.
- Nonresponse error: Businesses who were selected for the CES survey but did not respond reported less employment to the QCEW than those businesses who did respond to the CES survey.
And it said that “estimates of other errors, such as the forecast error from the net birth-death model [companies being created and shutting down], are not available at this time.”
This chart shows the preliminary benchmark revision of nonfarm payroll job growth, released yearly at this time of the year, for each March:
2 of the major categories were revised up:
| Transportation & warehousing | 6,600 | 0.1% | | Utilities | 3,700 | 0.6% |
12 of the major categories were revised down:
| Leisure and hospitality | -176,000 | -1.1% | | Professional and business services | -158,000 | -0.7% | | Retail trade | -126,200 | -0.8% | | Wholesale trade | -110,300 | -1.8% | | Manufacturing | -95,000 | -0.8% | | Information | -67,000 | -2.3% | | Other services | -51,000 | -0.9% | | Financial activities | -39,000 | -0.4% | | Private education and health services | -35,000 | -0.1% | | Government | -31,000 | -0.1% | | Construction | -29,000 | -0.4% | | Mining and logging | -4,000 | -0.7% |
The establishment survey data in the monthly jobs report will not be updated with these preliminary revisions. Instead, it will be updated with the final revisions that include monthly details, to be released in February 2026. We will cover that as we have in prior years with a chart with two lines, one color for the new revised data and another color for the old data.
Final revisions have differed significantly from preliminary estimates in the past. The final data released in February 2025 was less bad than the preliminary benchmark revision at this time last year.
Why wait so long for benchmarking?
One of the immediate things to do for the new BLS commissioner would be to shift benchmarking to a quarterly basis. This would produce four preliminary benchmark revisions a year, with final revisions when available. And at least four times a year, we’d have more accurate nonfarm payroll data. |


