Charted: The Rise of China’s R&D Spending
July 3, 2025
By Niccolo Conte
Article/Editing:Graphics/Design:
See this visualization first on the Voronoi app.
Use This Visualization
Charted: The Rise of China’s R&D SpendingThis was originally posted on our Voronoi app. Download the app for free on iOS or Android and discover incredible data-driven charts from a variety of trusted sources.
Key Takeaways- China’s R&D spending grew nearly sixfold between 2007 and 2023
- The United States leads in absolute R&D spending globally
Over the past two decades, global investment in research and development (R&D) has accelerated, but no country has seen a rise as dramatic as China.
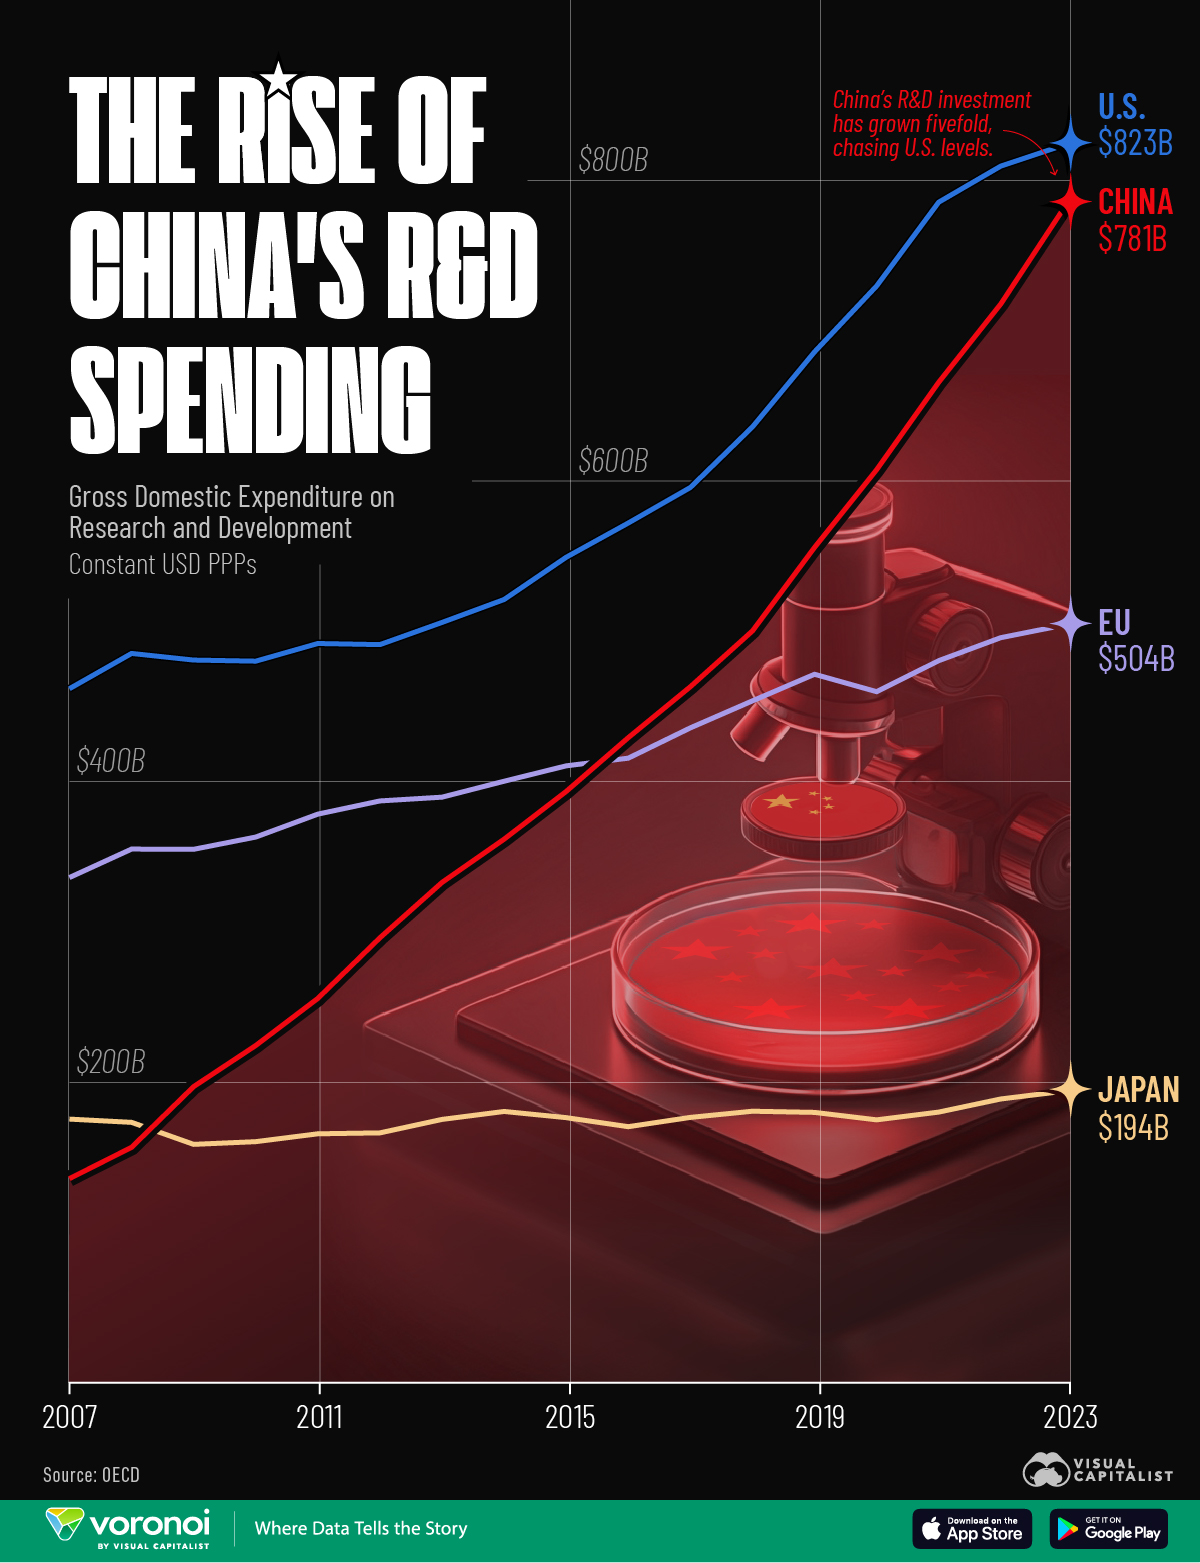
This chart visualizes the growth of Gross Domestic Expenditure on R&D (GERD) from 2007 to 2023 across four major economies: the United States, China, the European Union, and Japan.
The data comes from the OECD and is adjusted for inflation and purchasing power parity (PPP), allowing for a like-for-like comparison across countries and time.
China’s Innovation Spending Arc
Back in 2007, China spent just $136 billion on R&D—less than a third of the U.S. total and behind both Europe and Japan. But over the next 16 years, Chinese R&D spending grew nearly sixfold, reaching $781 billion in 2023.
That figure now puts it closely behind the United States, which spent $823 billion on R&D in 2023.
Country2007 R&D Spending2023 R&D Spending2007–2023 Growth (%)|
| China ???? | $135.8B | $780.7B | 475% | | U.S. ???? | $461.9B | $823.4B | 78% | | EU ???? | $336.2B | $504.0B | 50% | | Japan ???? | $175.4B | $193.9B | 11% |
The EU’s growth was modest over the period, while Japan’s spending remained nearly flat, with only a slight uptick.
Looking at spending by sector, the U.S. leads in business and higher education R&D expenditure. Many American tech manufacturers have significantly boosted their R&D investments in recent years, contributing to the domestic business total.
Meanwhile, China’s government sector R&D spending is 1.6 times that of the United States.
R&D spending as a percentage of GDP is highest in the U.S. and Japan, at around 3.45%. China follows at 2.58%, and the EU area spends the least with 2.13% of its GDP.
How Are Governments Allocating R&D Budgets?
Governments often increase R&D spending to drive innovation, boost economic growth, or achieve strategic objectives like military capabilities and energy independence.
In 2023, the OECD area allocated over $107 billion to the defense sector. The health sector received nearly $90 billion in monetary support, followed by the education (ex. university funds) and energy sectors.
Government R&D expenditure on energy and the environment and defense increased by 29% and 16%, respectively. On the contrary, R&D spending on health and education (ex. university funds) declined, following a sharp rise during the COVID-19 pandemic. |


