Just the facts, homogenization adjustments reduce global warming
Climatologists make adjustments to climate data to remove non-climatic changes (homogenization). This fact is used to accuse them of fiddling with temperature data to create or exaggerate global warming. This is often done by showing for a small piece of the data and suggesting it is typical. Often mentioned is the USA, where the raw data only show half the warming of the adjusted data. However, the USA is big, but still only 2% of the Earth's surface.
In recent weeks we had a similar case in The Telegraph about Paraguay. Last year we had similar misleading stories about two stations in Australia and the stations in New Zealand.
Global temperature collections contain thousands of stations. CRUTEM contains 4,842 quality stations and Berkeley Earth collected 39,000 unique stations. No wonder some are strongly adjusted up, just as some happen to be strongly adjusted down. In fact it would be easy to present a station where the raw data shows a cooling trend of several degrees being adjusted to a warming trend. However, then the reader might start to think if the raw data is really better.
The information on small regions or a few stations is normally not put into perspective: the average trend over all stations is only adjusted upwards slightly.
It is normally not explained why these adjustments are made nor how these adjustments are made.
Zeke Hausfather, an independent researcher that is working with Berkeley Earth, made a beautiful series of plots to show the size of the adjustments.
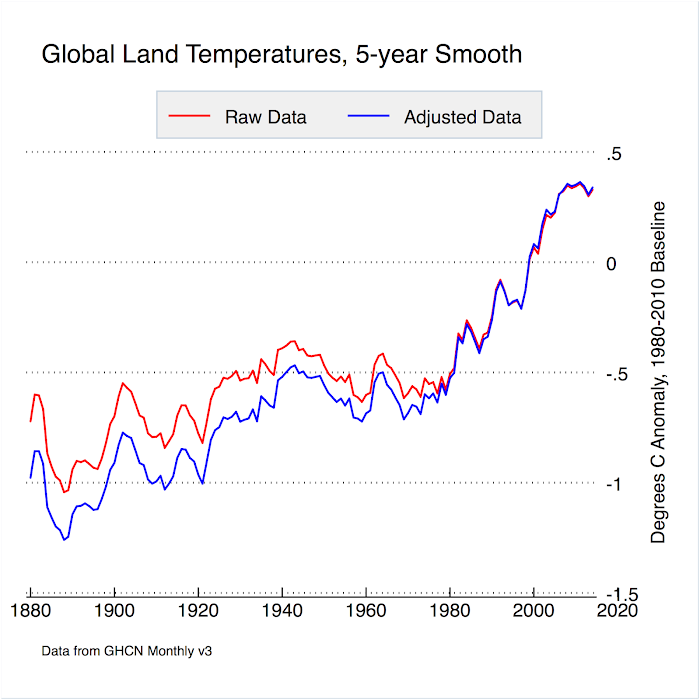
The first plot is for the land surface temperature from climate stations. The data is from the Global Historical Climate Dataset ( GHCNv3) of NOAA (USA). Their method to remove non-climatic effects (homogenization) is well validated and recommended by the homogenization community.
They adjust the trend upwards. In the raw data the trend is 0.6°C per century since 1880 while after removal of non-climatic effects it becomes 0.8°C per century. See the graph below. But it is far from changing a cooling trend into strong warming. (A small part of the GHCNv3 raw data was already homogenized before they received it, but this will not change the story much.)
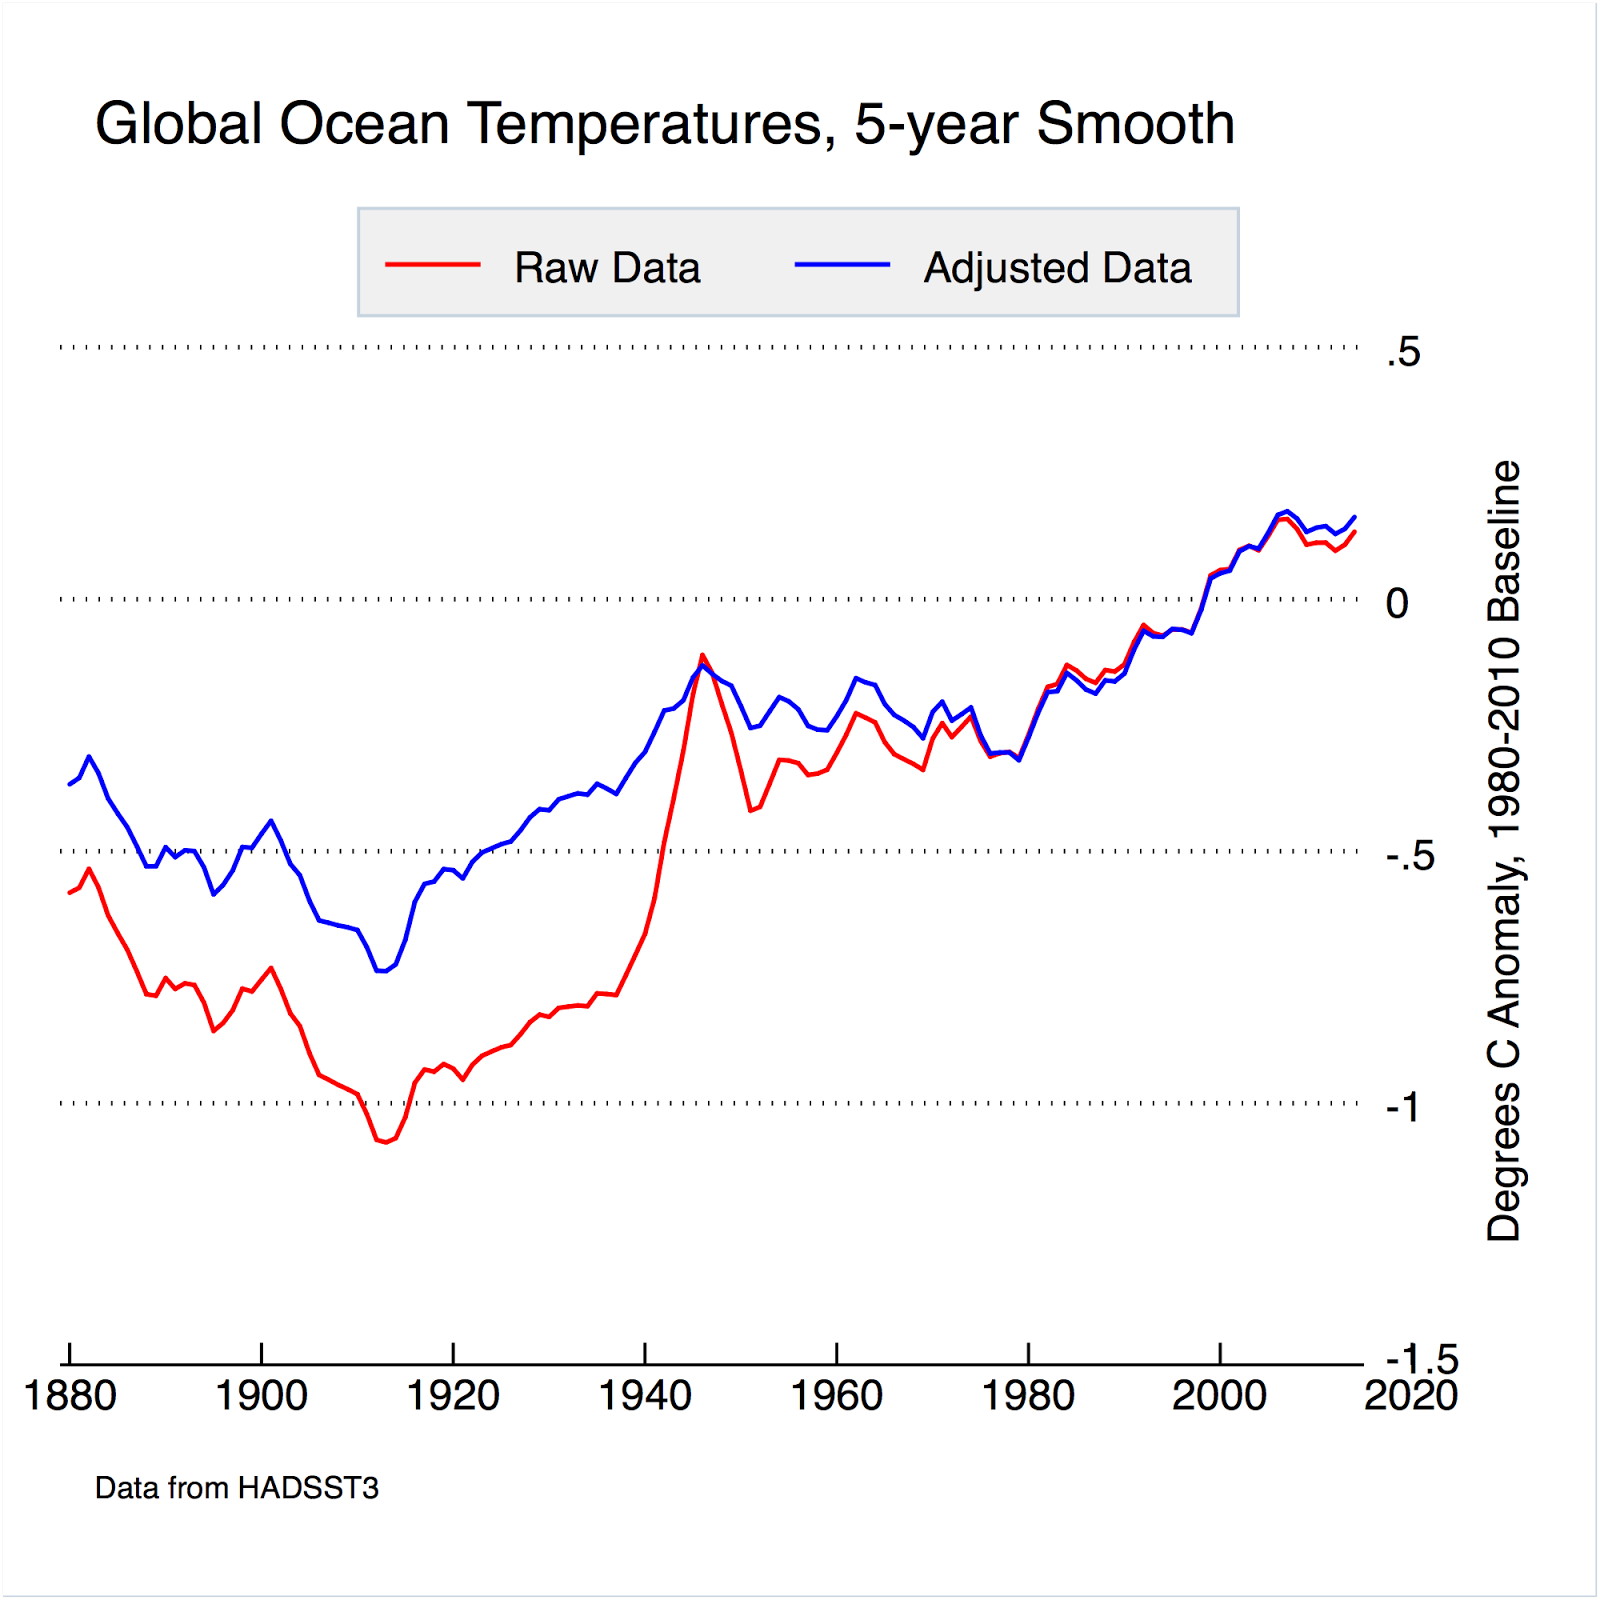
Not many people know, however, that the sea surface temperature trend is adjusted downward. These downward adjustments happen to be about the same size, but go into the other direction. See below the sea surface temperature of the Hadley Centre ( HadSST3) of the UK MetOffice.

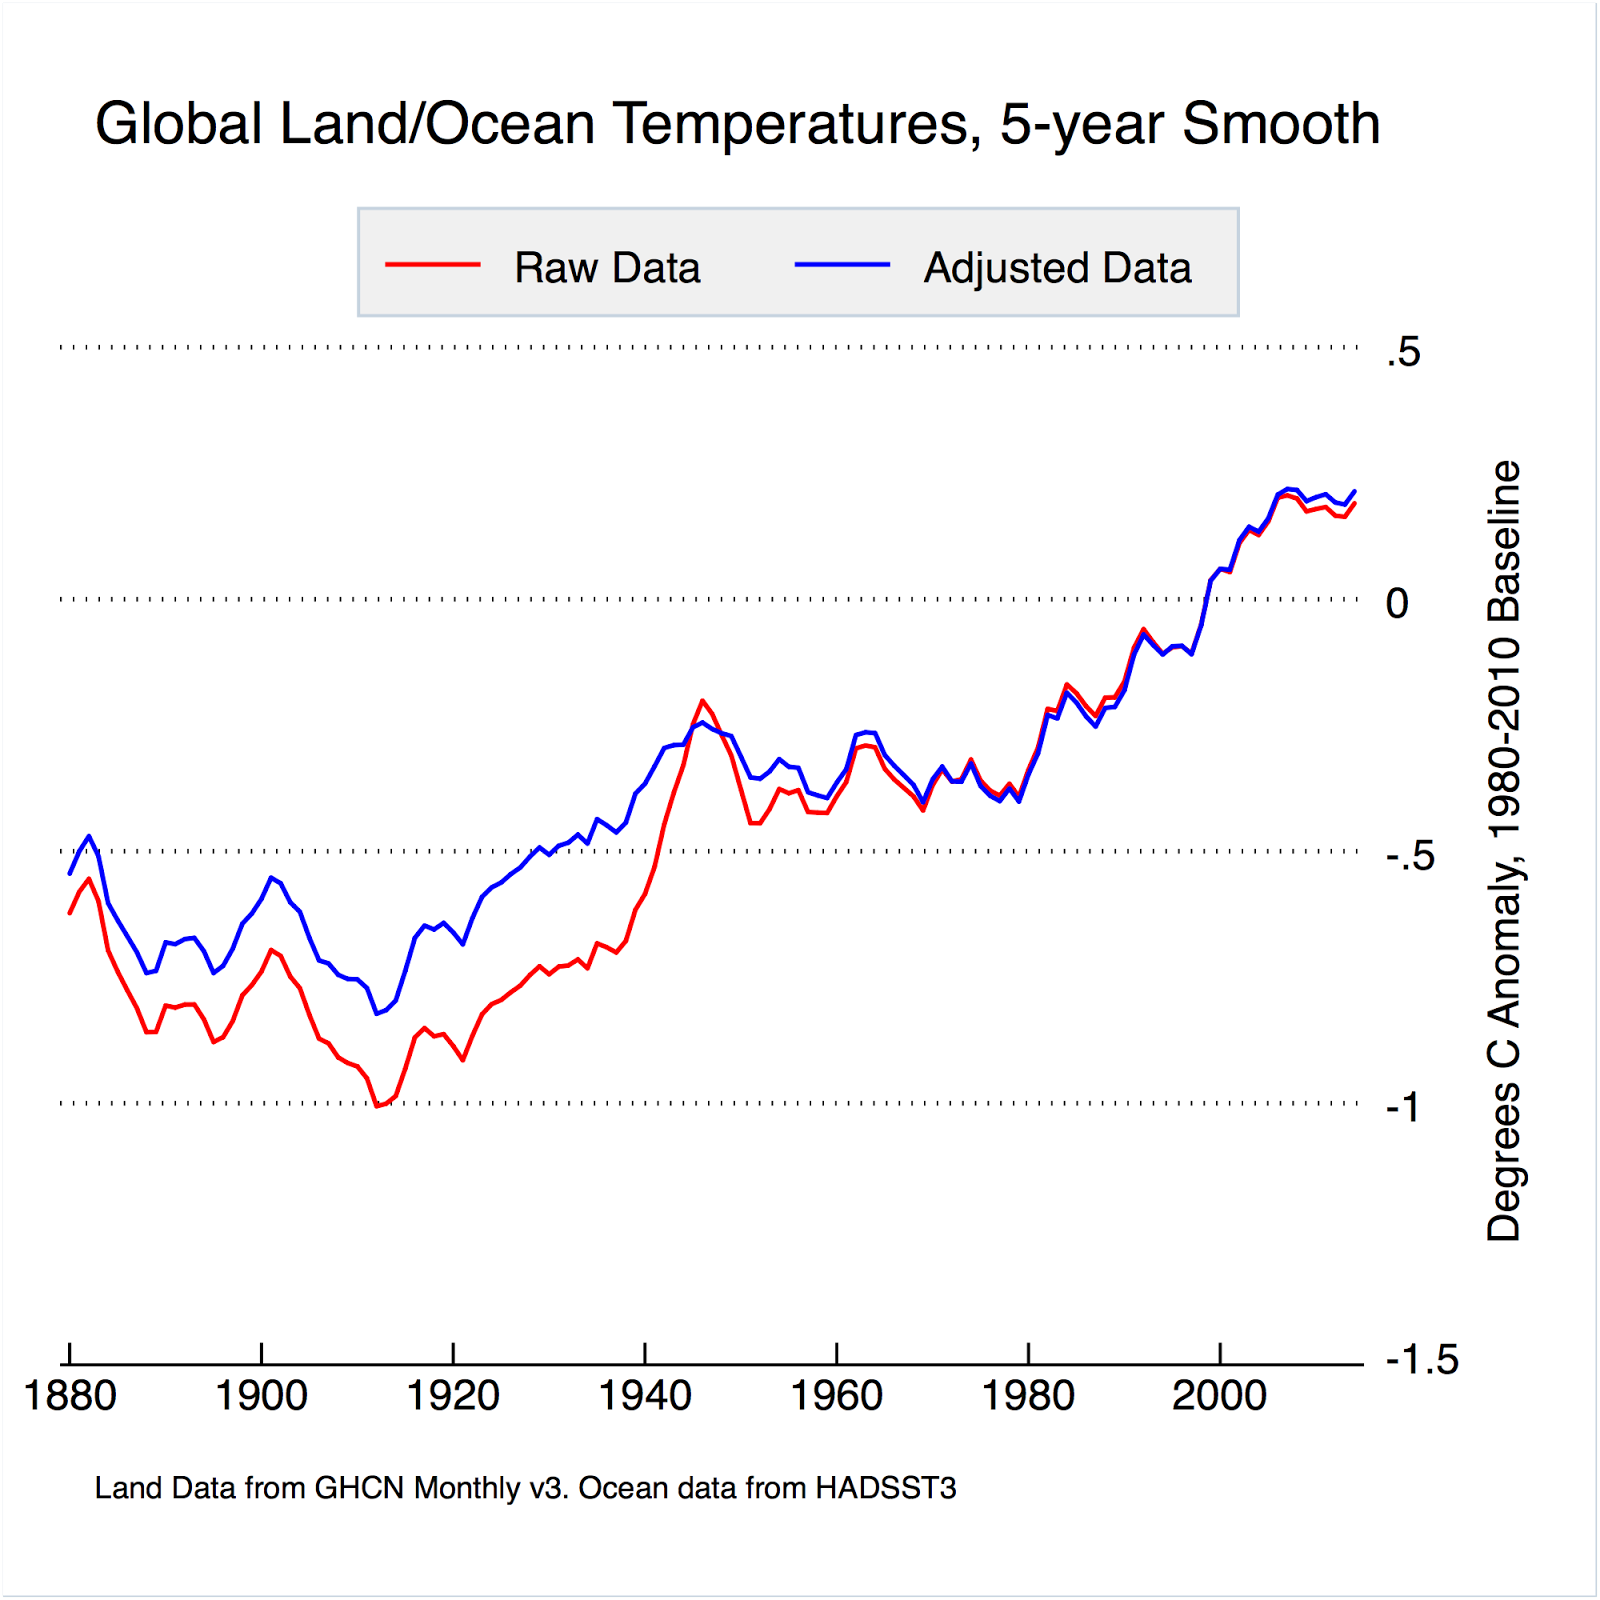
Being land creatures people do not always realise how big the ocean is, but 71% of the Earth is ocean. Thus if you combine these two temperature signals taking the area of the land and the ocean into account you get the result below. The net effect of the adjustments is a reduction of global warming.
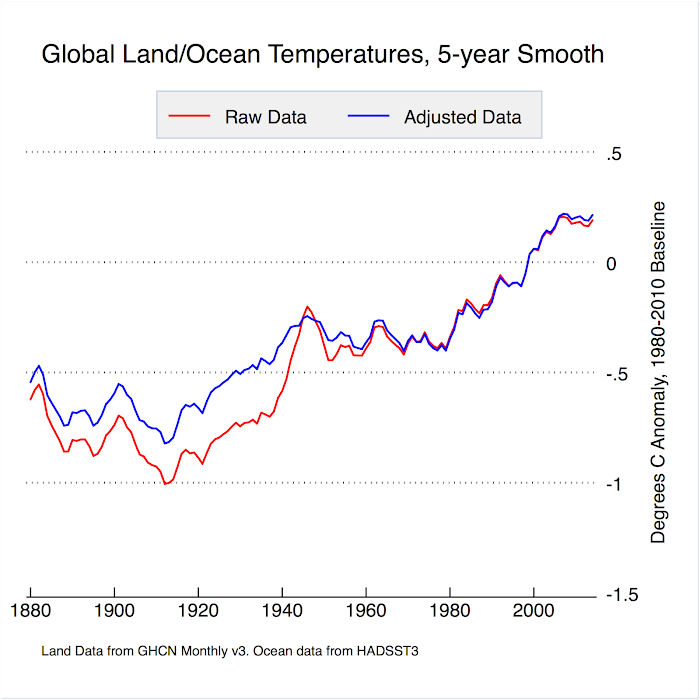
It is pure coincidence that this happens, the reasons for the adjustments are fully different.
The land surface temperature trend has to be adjusted up because old temperatures were often too high due to insufficient protection against warming by the sun, possibly because the siting of the stations improved and there are likely more reasons.
The old sea surface temperature are adjusted downward because old measurements were made by taking a bucket of water out of the ocean and the water cooled by evaporation during the measurement. Furthermore, modern measurements are made at the water inlet of the engine and the hull of the ship warms the water a little before it is measured.
But while it is a pure coincidence and while other datasets may show somewhat different numbers ( the BEST adjustments are smaller), the downward adjustment does clearly show that climatologists do not have an agenda to exaggerate global warming. That would still be true if the adjustments had happened to go upward.
variable-variability.blogspot.com |