OMG.... Obama firing on all cylinders... this is horrible news for liar in chief Trump and the right wing doomsayers.

New Census data show strong 2015 earnings growth across the board, with black and Hispanic workers seeing the fastest growth
epi.org
Today’s Census Bureau report on income, poverty, and health insurance coverage in 2015 shows that median household incomes for all race and ethnic groups increased between 2014 and 2015. Encouragingly, groups that, by and large, had seen the worst losses in the years since the Great Recession saw the biggest earnings gains in 2015. Real incomes increased 6.1 percent (from $42,540 to $45,148) among Hispanics, 4.4 percent (from $60,325 to $62,950) among non-Hispanic whites, 4.1 percent (from $35,439 to $36,898) among African Americans and 3.7 percent (from $74,382 to $77,166) among Asians. While the increase in incomes was statistically significant for all groups except Asians, racial income gaps remained unchanged between 2014 and 2015. The median black household earned just 59 cents for every dollar of income the white median household earned, while the median Hispanic household earned just 71 cents. Meanwhile, households headed by persons who are foreign born saw an increase in incomes of 5.3 percent between 2014 and 2015 (from $49,649 to $52,295), compared to an increase of 4.4 percent (from $54,741 to $57,173) among households with a native-born household head.
Based on EPI’s imputed historical income values (see the note under Figure A for an explanation), real median household incomes for all groups, except Hispanics, remain well below their 2007 levels. Between 2007 and 2015, median household incomes declined by 6.8 percent (-$2,686) for African Americans, 3.2 percent (-$4,662) for whites and 5.4 percent (-$7,158) for Asians, but increased 5.4 percent ($2,310) for Hispanics. Asian households continue to have the highest median income, despite large income losses in the wake of the recession.
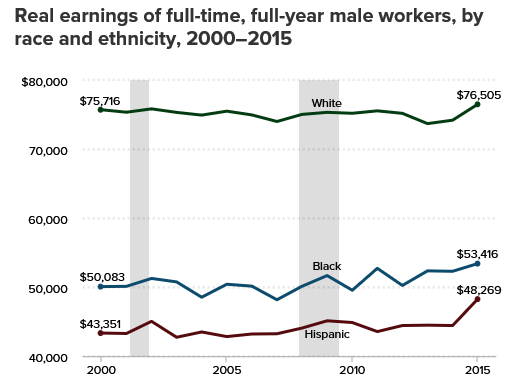
The primary driving force behind the slow return to pre-recession income levels has been stagnant wage growth. Real wages had been essentially flat since 2000, but wage growth received an added boost in 2015, as a result of low inflation. From the start of the recovery in 2009 through 2015, real earnings of men working full-time, full-year are up for all race and ethnic groups—white men (1.5 percent), Hispanic men (7.0 percent), and black men (3.4 percent). As a result, the black-white male earnings gap is unchanged, but the Hispanic-white male earnings gap narrowed. Black men earned 70 cents for every dollar earned by white men in 2015 (compared to 69 cents/dollar in 2009) and Hispanic men earned 63 cents on the dollar (compared to 60 cents/dollar in 2009).

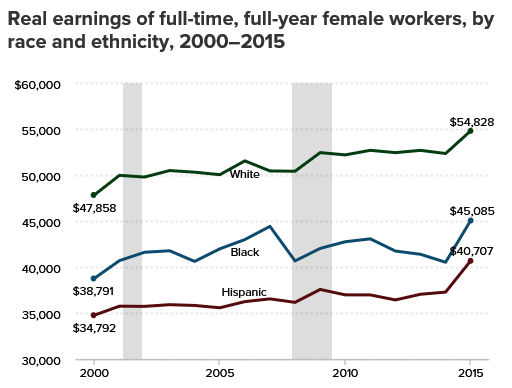
Among female workers, African American women received a sizable increase in earnings after experiencing losses every year between 2011 and 2014. Black women’s earnings are up 7.2 percent since 2009, compared to 4.5 percent for non-Hispanic white women and 8.3 percent for Hispanic women. Nearly all of this growth occurred between 2014 and 2015. In 2015, black women earned 82 cents for every dollar earned by white women (up from 80 cents/dollar in 2009) and Hispanic women earned 74 cents on the dollar (up from 72 cents/dollar in 2009).
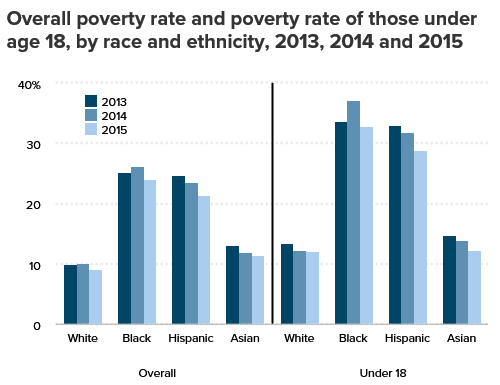
The 2015 poverty rates also reflect the income growth between 2014 and 2015. Poverty rates for all groups were down, but remain highest among African Americans (24.1 percent, down 2.1 percentage points), followed by Hispanics (21.4 percent, down 2.2 percentage points), Asians (11.4 percent, down 0.6 percentage points) and whites (9.1 percent, down 1 percentage point). African-American and Hispanic children continue to face the highest poverty rates—32.9 percent of African Americans and 28.9 percent of Hispanics under age 18 live below the poverty level—although these rates also improved between 2014 and 2015. Despite these improvements, African American children are nearly 3 times more likely to be in poverty than white children.
While today’s report provides a snapshot of the current economic condition of America’s largest racial and ethnic groups, Thursday’s release of the 2015 American Community Survey will provide an update on the Native American population and disaggregated data for the various ethnic groups that make up the Asian population. |


