Thanks for the reply dabum. Once again I appreciate that you are managing risk and agree that is a critical and valid.
However on some levels I find your reply unsettling, as it seems to ignore the realities around it. I don't see how it is noble to stand in the face of a storm, when one can see the storm clouds brewing, and take the hit, just because the hit is in the plan and is an acceptable risk. If one can see the hit coming isn't it a wise money management technique to stand aside until the storm blows over? Least this is misinterpreted and gets me excused from the class, let me explain.
I just do not understand managing risk on one time frame alone with out regard to the larger market or the stock's internals. Following Pring's advice one needs to assume that a trend is still in place until the weight of the evidence suggests otherwise. I think the 'weight of the evidence' can and does come quite often before the maximum risk is achieved and thus from this chair I don't understand taking that ride down all the way to the predetermined stop level. {Is the objective learning to trade (reading what the market is doing and responding)?]
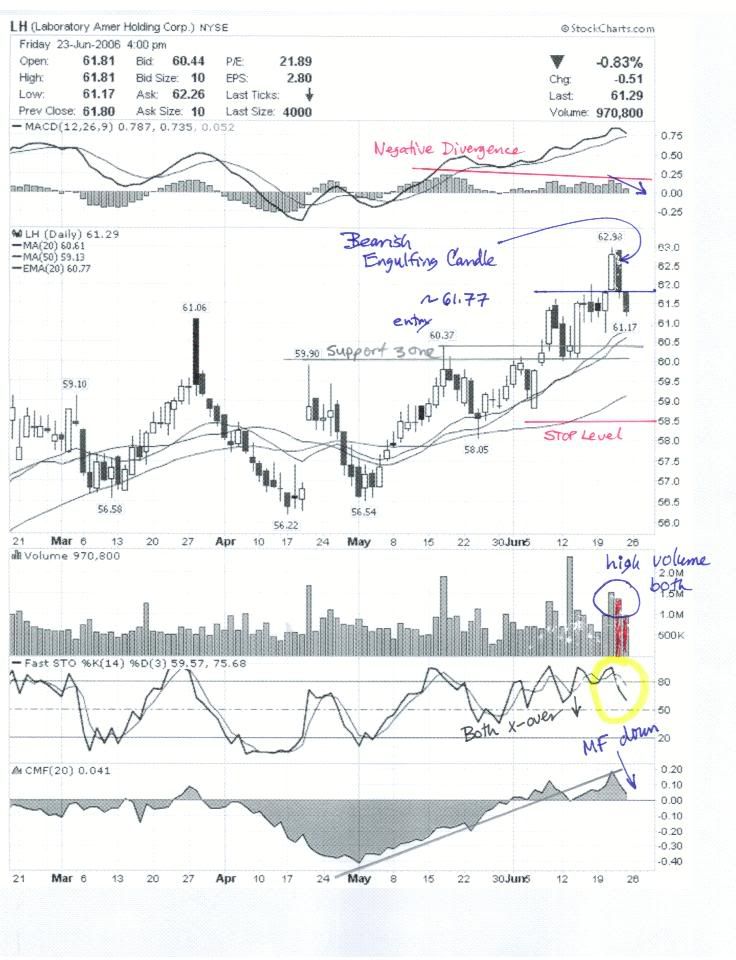
Now back to LH, looking at the weekly chart we see a pretty good topping tail indicating that the breakout was a false breakout. In fact, all of the gains made this week were given back to the market as the price closed this week where it closed the previous week. In the last eight months topping tails have not lead directly to a strong up week immediately following. Most have been followed by down weeks. {Oct, Jan, Mar, Apr} On top of that I note negative divergences in the three shown volume related indicators. Perhaps if the price had been 0.01 lower and then the candle and volume bar were red, then the concern might be a bit clearer. So with the choppy summer market we are in, inflation looming on the minds of market participants, and TA weight of evidence suggesting that the tide has turned, why persist with the trade? Wouldn't it be better to step aside with a smaller loss, regroup and if one thinks the stock will recover, catch it on the rebound when the weight of the evidence points up?
stockcharts.com
But drilling down to a daily level the story looks less compelling. The first thing that jumps out at me on this chart is that the day after the trade was triggered the next candle printed was a bearish engulfing candle! Along with that is a high volume day. I note that Pring observes that it is normal for volume to contract as price falls but above average volume on a drop is a bad sign. So on this level we see that the breakout has failed with tracks laid for further downside. Now I know you don't like other indicators but as Elder observes the strongest signal in TA is divergences between MACD-Histogram and price. Clearly we have a Type A divergence between price and MACD. Of course the histogram bars show a trend change to a downtrend. Additionally CMF shows a nice pull back from its up trend. The next zone of support lies in the 60.40 to 59.90 level.
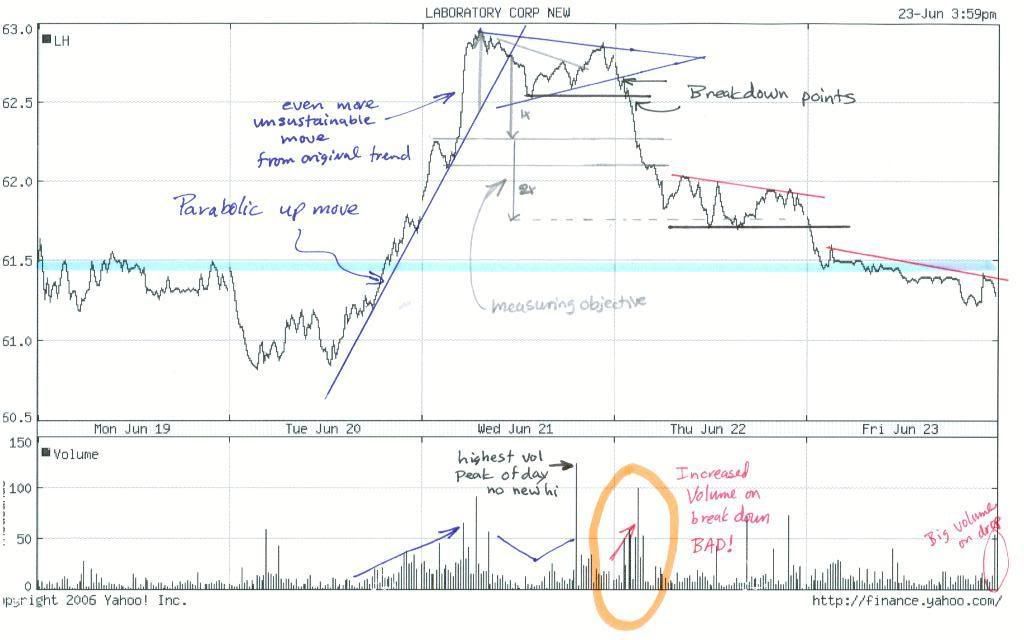
But drilling down one more level to the intraday, the morphology of the false breakout becomes even more apparent. I actually saw this real-time on the hourly charts. The ST trend upward move that triggered the trade was a near parabolic move. In its favor was the increasing volume to support the move. The problem came when that move went vertical on the second day, and unsustainable move. So a pull back was in the cards. Now the problem comes when later in the day the price rallies on the highest single period volume but the price fails to make a new high. More signs of correction. But the clincher comes when the topping pennant is violated to the down side, and the support level from the previous day’s intraday low is also violated ON INCREASED VOLUME. Then later in that same day we see a few volume spikes that are unable to drive the price above a previous peak and thus forms a descending right pennant.
So why doesn’t it make sense to look at the daily chart, and at least on seeing the formation of dark cloud cover or a bearish engulfing candle tighten up the stop until the pattern resolves its self? Sure, one is willing to take the risk outlined in the original stop, but in the face of the weight of the evidence, why take most if not all of that ride down to |


