A few months old...Stuart just gave a paper at APSO, and will post new data shortly....
Right now, May 2005 is the winner, but December 2005 and April 2006 are statistical ties. Minor revisions and changes to methodology could very easily change which is exactly the winner (indeed it was December 2005 for a while). But anyway, the oil industry doesn't seem to quite be able to tip it past the 85mbpd mark (on a combined agency basis) for the time being.
Finally, some folks expressed interest in just looking at crude plus condensate (ie real honest-to-God oil, rather than including natural gas liquids, biofuels, CTL, etc, etc). The EIA tracks that in Table 1.1, and here is the plateau in that:
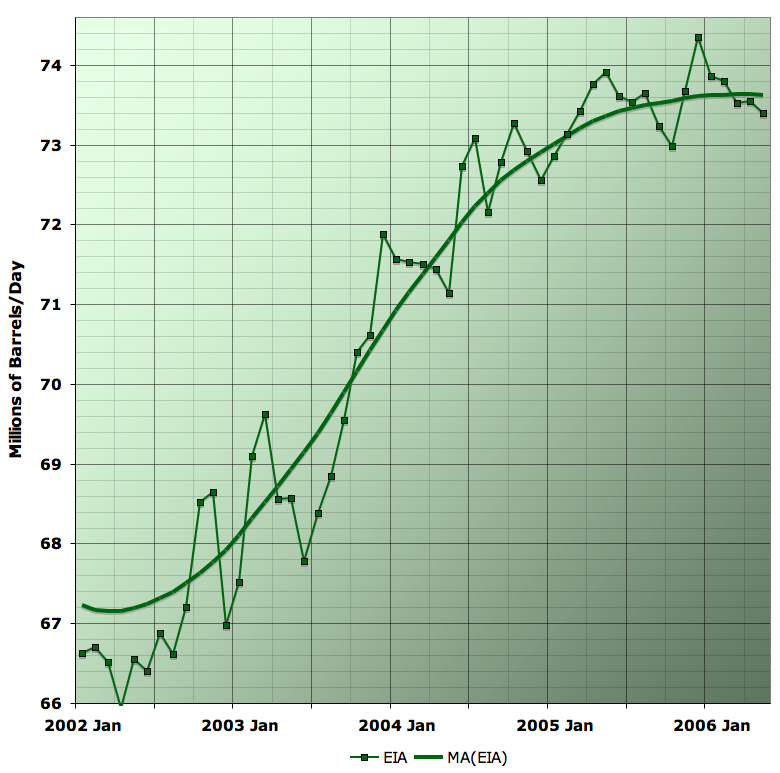
Global crude and condensate production from Jan 2002 to May 2006, together with 13 month moving average, recursed once. Source: EIA International Petroleum Monthly Table 1.1c.
theoildrum.com
Found some data thru July...
It starts to look like a plateau
Rune in Norway, Energy Resources
The blogspot energikrise.blogspot.com recently posted updated diagrams for the development in world oil supplies (believed to be all liquids) based upon data from EIA Petroleum International Monthly for October 2006 which includes data as of July 2006.
The data from EIA shows that the world supplies of oil were down with an average of 0,18 Mb/d for the 7 first months of 2006 relative to the same period of 2005, and that the supplies of regular oil and lease condensate so far still had a top back in December 2005.
For the last 22 months (September 2004 - July 2006) the arithmetic average for oil supplies was 84,25 Mb/d, and supplies have been running within 1 % of this average for these months.
OPEC (the second diagram) supplies (oil, lease condensate and NGL's) have so far had a top back in September 2005.
OPEC supplies (oil, lease condensate and NGL's) are down 0,29 Mb/d for the 7 first months of 2006 compared to the same period of 2005.
energybulletin.net
==================
"there is an infinity of different shapes that
such a curve may have.” (Hubbert ,1949)"
That's probably why he didn't give his paper until '56. He was predicting a world peak around '96. It is now felt that the oil shocks in the 70's slowed the world economy enuf to push that back 10 years, which is roughly now.
===========
The theory is named after American geophysicist Marion King Hubbert, who created a model of known oil reserves, and proposed, in a paper he presented to the American Petroleum Institute in 1956 [3], that production of oil from conventional sources would peak in the continental United States between 1965 and 1970, and worldwide within "about half a century" from publication
en.wikipedia.org |


