The Scales are Balanced
Posted by Phil Hart on April 14, 2008 - 10:02am in TOD: Australia/New Zealand
2002 Net Change: -934 kb/d
2003 Net Change: +2,279 kb/d
2004 Net Change: +3,065 kb/d
2005 Net Change: 1,294 kb/d
2006 Net Change: -267 kb/d
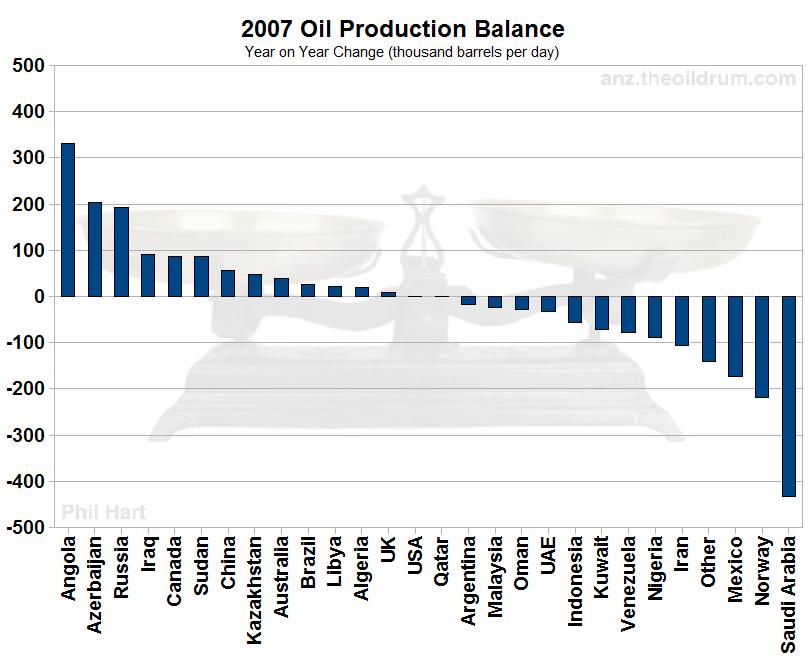
2007 Net Change: -264kb/d
===
Russia publishes very transparent and up to date information on their crude oil production here: riatec.ru
They have been declining since December, down a little under 3%, with the data up to date through April 12.
Based on 2007 annual data, the largest six countries / areas show the following production in (000) barrels per day.
Russia__ 9,437
Saudi Arabia__ 8,722
United States__ 5,103
North Sea__ 4,114
Iran__ 3,922
China__ 3,729
At this point, all of these countries/areas are showing signs of possibly being past peak.
anz.theoildrum.com |


