Daily, Weekly, and Monthly Chart & Fundamental Analysis of the Dow...
The Video Charts for the end of the week chart and fundamental analysis of the Dow's daily and weekly charts for the week ending March 20, 2009 are now available to view...They are only about 15 minutes long...While it's nice to see these charts here, I go into great detail while talking about things in the Video Chart...You can find them on the IHUB Homepage in the Video Charts section, about halfway down in the left hand column...
siliconinvestor.com
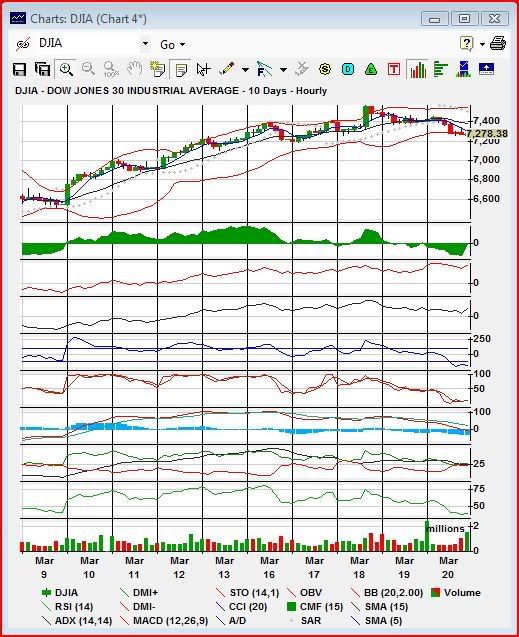
The hourly chart is very oversold, and it's at the lower Bollinger Band, so that pullback was necessary to keep the chart healthy after a nearly 1000 point move up...
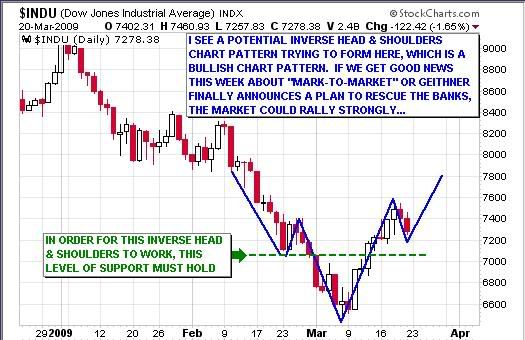
Here is a "possible" bullish Inverse Head & Shoulders chart pattern I see forming if the good news outnumbers the bad news this week:
Explanation of an Inverse Head & Shoulders chart pattern:
leavittbrothers.com

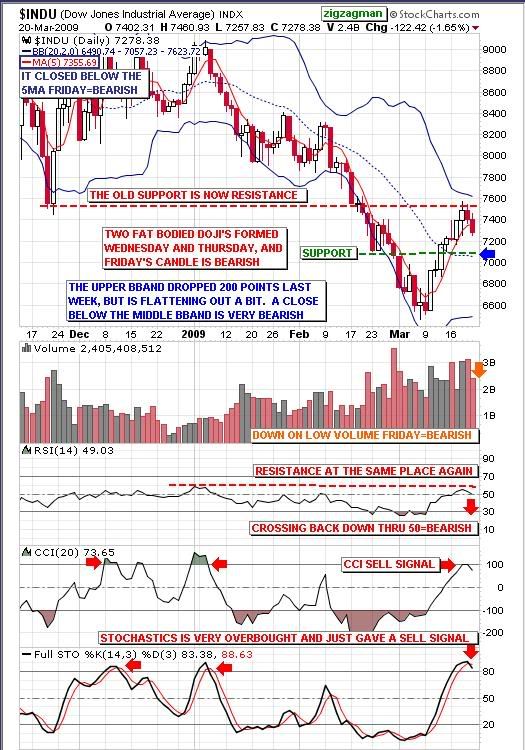
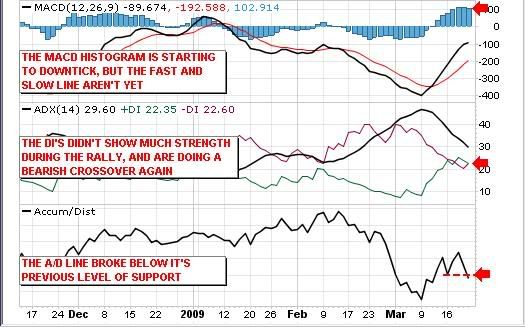
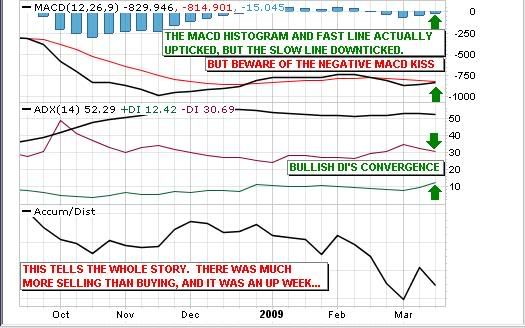
Other than the shape of last week's candlestick, which is a bearish Shooting Star, most of the technical indicators on the weekly chart aren't in too bad of shape...Except for the Accumulation/Distribution line that shows massive selling last week...

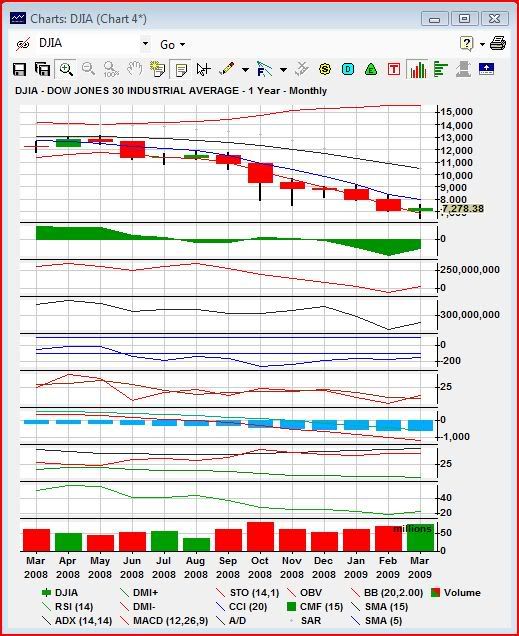
The candlestick for the month so far is a doji, which can mean one of two things...It can signal a reversal of the downtrend...Or, it can signal a continuation of the downtrend after a time of indecision...We won't know the real story until this month is over, but most of the lower technical indicators are showing some bullish characteristics so far, except for the DI's of the ADX and the ADX and MACD fast and slow lines...The Moving Averages take a very long time to finally start to show some improvement, since they are lagging indicators on a monthly chart......
Happy Trading next week,
zigzagman |


