Wow - thanks Tommaso, much appreciated on the charting kudos.
We're basically tracking on the pump being primed, and that credit issues like fear are primary in holding the inflation explosion back.
Here are a couple more charts from last year that I don't recall posting here, but might have - and they also address the poor credit picture... and they will certainly create a pain in the posterior for the deflationary crowd - and perhaps even a few of the more rabid Austrians. <g>
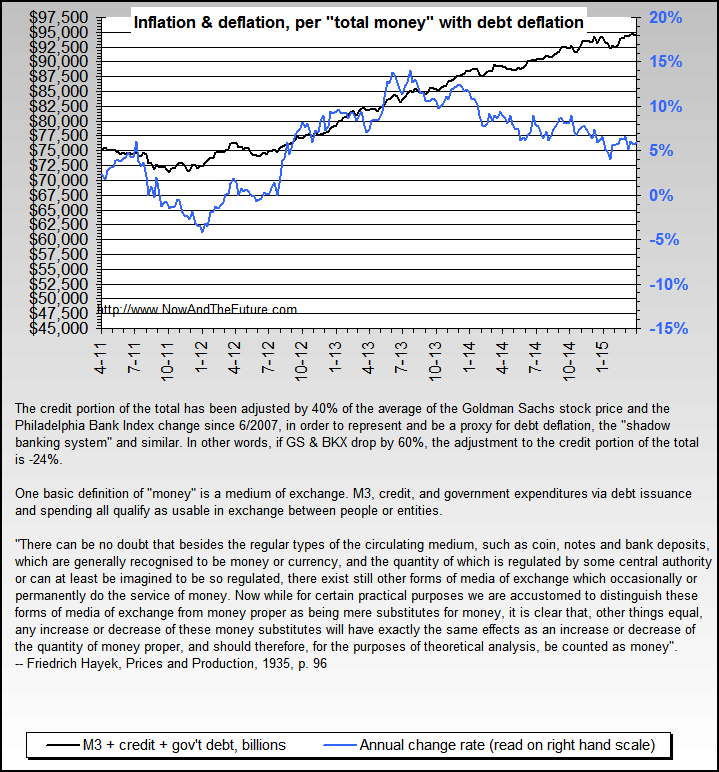
They simply add together M3, all credit and all Federal and state debt - based on the raw concept & definition of money being "a medium of exchange" - and all three may certainly be used to buy things or make deals, etc. In other words, it's a grand total money supply with an accent on the K.I.S.S. principle of total money supply.
I also freely admit that there's some double counting involved, but also submit that the double counting is both quite similar in ratio and relative amounts from month to month or year to year, and also that its quite minimal in the scheme of things... and I do expect deflation folk to b*tch about the double counting, while also being unable to specifically show how its significant to the basic message of the charts.
Since the middle of 2007, the total has been adjusted for "debt deflation" by using GS and the BKX changes as a proxy for it. The purpose is to actually reflect that money in the form of credit has actually been destroyed since roughly mid 2007, most obviously in mortgages but also and to a lesser degree in stocks, etc.
As a bonus, it actually does show a bottom in total money supply around February/March/April 2009 - surprise, surprise... and it also shows a view of how much the whole idea of money is an "idea backed by confidence" (aka CONfidence <g>)
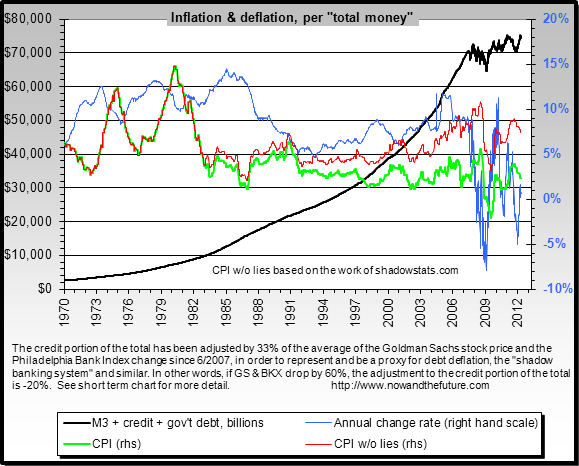
Same data, but showing it since 1970:
One of these days when I get fired up a bit, I'll write an article around those charts... and then sit back and watch the fur fly. <g> |


