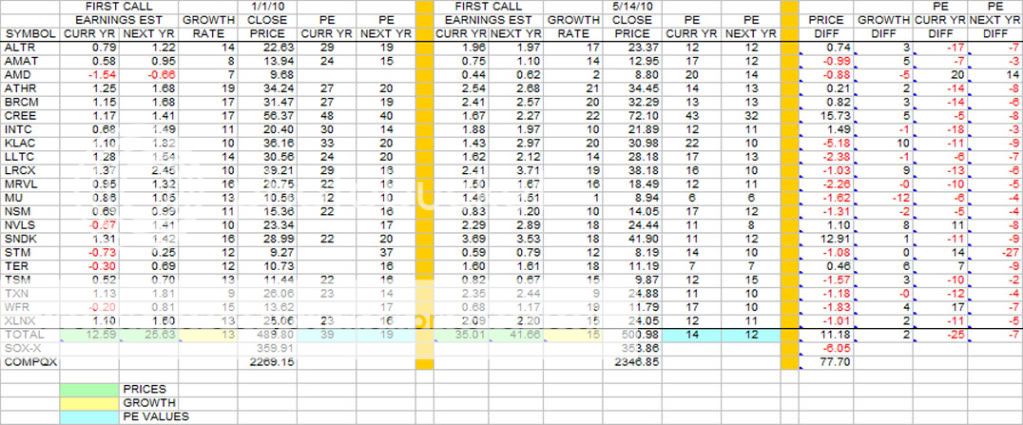
Since the first of the year, the SOX has gone through ups and downs, and as of last Friday's close, the index is near the value at the beginning of the year. Over that period, the individual stocks in the index have changed earnings estimates, growth and prices. Prior to the beginning of the year, the SOX was composed of 18 stocks, but at the beginning of the year, ATHR, CREE and LRCX were added to the index.
The table shows changes for the individual stocks and results at the bottom line. Over this 4+ month period, earnings estimates have increased on a consistent basis for both the Group and the SOX as shown on a weekly basis in the table
Message 26539859
to very high values compared to the beginning of the year. This in turn has compressed PE values to very low levels compared to the earlier numbers. The Growth estimate at the bottom line has also increased by 2 points.
At the bottom line, the SOX closed down 6.05 on Friday compared to 1/1/10. Looking at the individual price difference of the individual stocks, most have decreased values with a few stocks up slightly. However, two stocks really stand out in this regard, CREE and SNDK, which are up by relatively large numbers. If not for the huge gains of these 2 stocks, the SOX would be down much more than 6.05 posted. Counting these 2 stocks, 8 of the stocks were up over the period while the remaining 13 have lost value.
Of course, this type of behavior has occurred many times in the past - rising earnings estimates with PE compressions to very low values. The big question is - is this just a "pause for refreshment"(pardon the pun) towards a higher index price or do we continue the ups and downs of the SOX index in the present price range for the next year or so? We could also drop back into the 200 to 300 range for awhile.
 |


