SI
SI
discoversearch

We've detected that you're using an ad content blocking browser plug-in or feature. Ads provide a critical source of revenue to the continued operation of Silicon Investor.  We ask that you disable ad blocking while on Silicon Investor in the best interests of our community.  If you are not using an ad blocker but are still receiving this message, make sure your browser's tracking protection is set to the 'standard' level.
Politics : Politics of Energy

 Public ReplyPrvt ReplyMark as Last ReadFilePrevious 10Next 10PreviousNext  
To: Road Walker who wrote (21722)7/11/2010 7:36:31 PM
From: Brumar893 Recommendations  Read Replies (1) of 86350
 
Who is that can't believe their lying eyes?

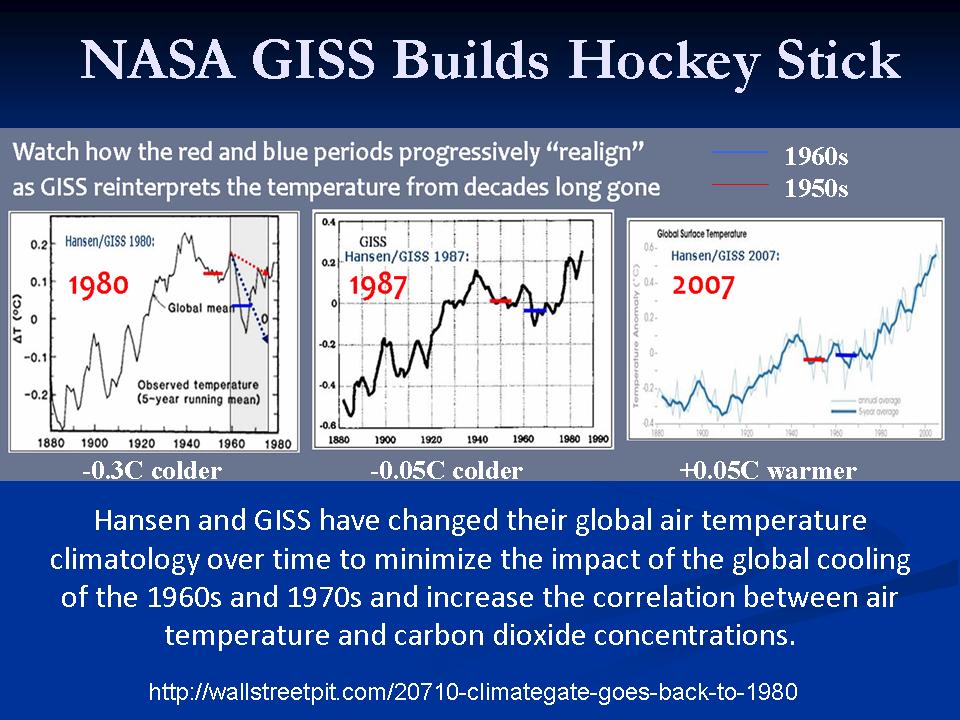
NASA’s GIStemp program recalculates old temperatures with every new data run. Like CRU and NOAA, NASA has managed to cool off the prior warm period (like Michael mann did with the Medieval Warm Period. See below (enlarged here) how in 1980, Hansen had the 1960s 0.3C colder than the 1950s. By 1987, it was just 0.05C colder and by 2007 it had become 0.05C warmer.

Or you can compare the temperature in 1940 with the temperature in 1980. In 1980, NASA said 1940 had been warmer, but they changed that AS EVERYONE CAN SEE!


icecap.us

sppiblog.org

[ Graphic proof that NASA lies and liberals don't care.

In the 1980's they said the 1960's were significantly cooler than the 1950's, by 2007 the 1960's had become WARMER than the 1950's.

More graphic evidence below of global warming scamsters revising the temperature record to better support their con. ]

The Hoax uncovering Hansen's Hoax!

There has been a fascinating hoax discovered recently when a Fourth Grader in Beeville USA won national publicity for winning a national honor for her project on debunking Global Warming. It turns out that the honor , received in the mail was a hoax by unknown persons. However the publicity has piqued the curiosity of some researchers who have looked in detail at the Beeville temperature profile for the last hundred years or so. The blue graph is the unadjusted temperatures showing no warming and the red graph is the adjusted graph and voila we have warming.


2.bp.blogspot.com

The grubby fingers of Hansen and his cronies can be seen all over this and we owe thanks to Julisa Castillo for unwittingly bringing this to our attention.Maybe this was the hoaxer's intention in the first place?

ozclimatesense.com
Report TOU ViolationShare This Post
 Public ReplyPrvt ReplyMark as Last ReadFilePrevious 10Next 10PreviousNext