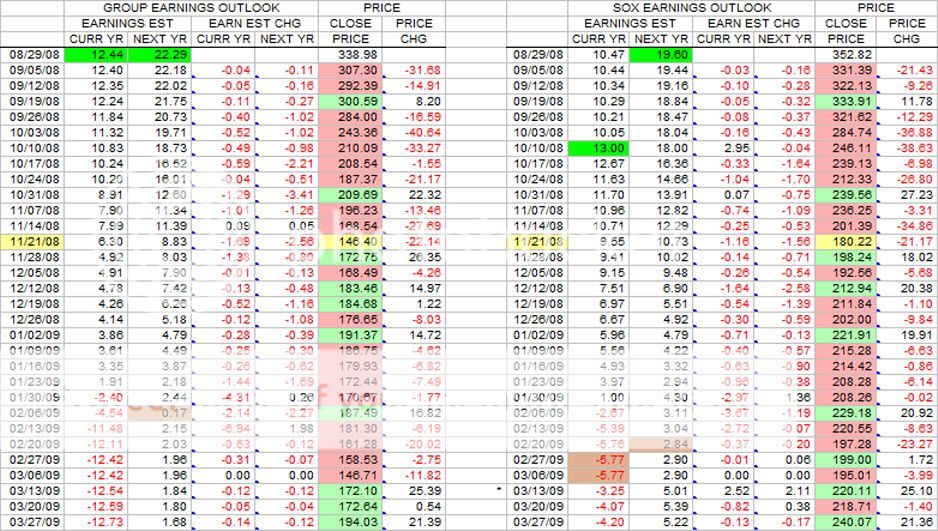
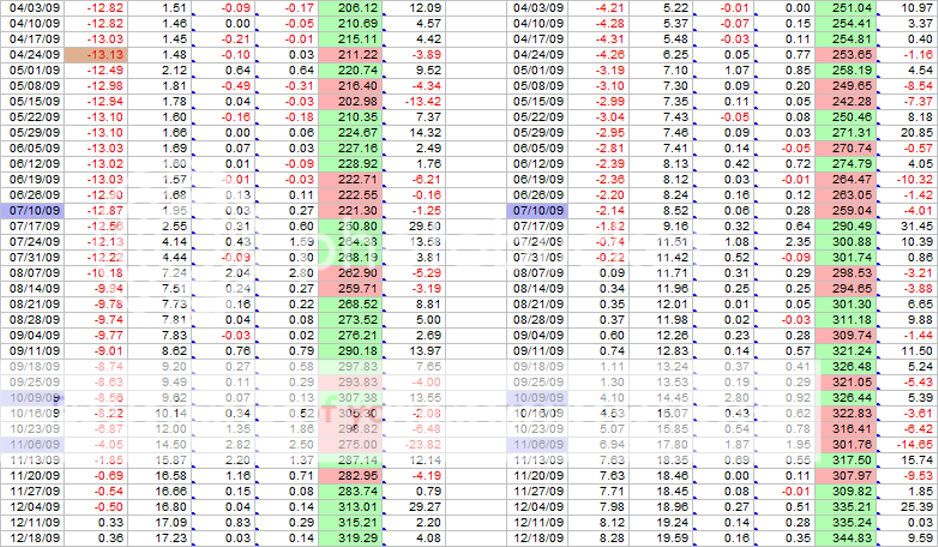
This is the weekly update of the Group and SOXM(SOX) tables in terms of earnings estimates and price changes.
First of all, the past week was very positive in terms of the index changes to the upside. The SOX closed the week with a new high for the table at 412.43. This eclipsed the old high of 400.42 set during the week of 4/23/2010. Prior to that high, the last time the SOX was over 400 was the week of 2 June 2008 at 405.48, 2 and 1/2 years ago.
The table at the bottom, in combination with the main table, gives a glimpse of what is happening presently with the index prices and stock earnings. The bottom table shows the rapidly climbing PEs and PEGs. In just 2 weeks, the PE has gone from 11.9 to 12.9, and the PEG has gone from 0.87 to 0.94. If this rate of growth continues, the PE and PEG of 14.5 and 1.11 will soon be reached that occurred during the week of 4/23. In the meantime, looking at the main table, earnings estimates have peaked(dark green markers) and may still be on a downtrend. With the end of the FY/CY only 4 weeks away for the majority of the stocks, Nxt Yr data will "roll over" to Curr Yr data and a new set of Nxt Yr data will be posted. This action will start during the 2nd/3rd week of Jan and last for about a month. This new set of data and results of this quarter, plus any big changes in the world and U.S. economic situation is bound to have a big impact on the direction of the SOX during the year. What we need is the setting of an environment of "irrational exuberance" for the SOX to reach 550.

 |


