SI
SI
discoversearch

We've detected that you're using an ad content blocking browser plug-in or feature. Ads provide a critical source of revenue to the continued operation of Silicon Investor.  We ask that you disable ad blocking while on Silicon Investor in the best interests of our community.  If you are not using an ad blocker but are still receiving this message, make sure your browser's tracking protection is set to the 'standard' level.
Technology Stocks : Semi Equipment Analysis
SOXX 297.50-2.6%Nov 6 4:00 PM EST

 Public ReplyPrvt ReplyMark as Last ReadFilePrevious 10Next 10PreviousNext  
To: Donald Wennerstrom who wrote (50376)12/11/2010 6:24:35 PM
From: Donald Wennerstrom2 Recommendations  Read Replies (2) of 95378
 
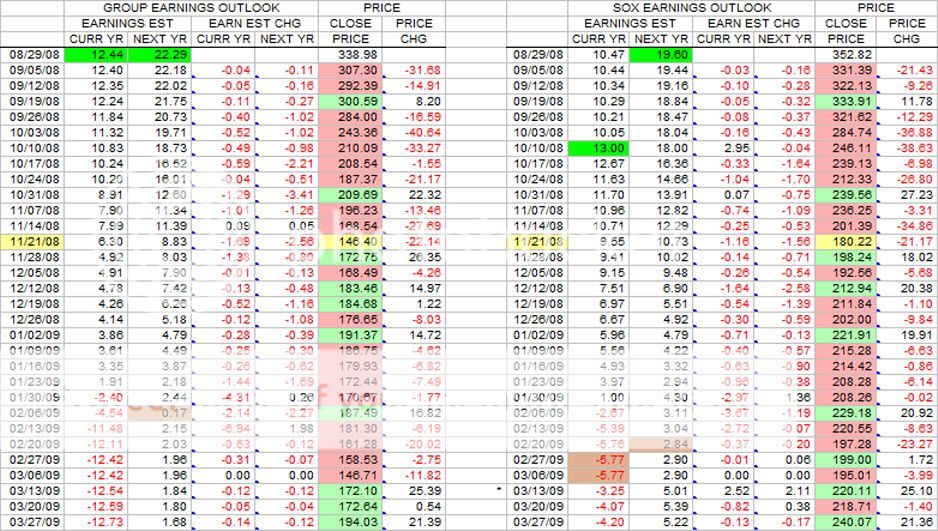
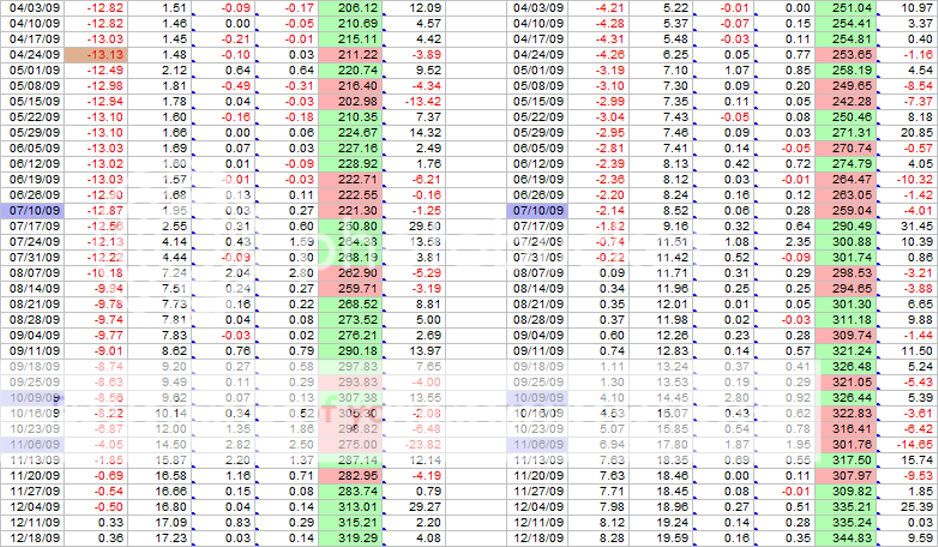
This is the weekly update of the Group and SOXM(SOX) tables in terms of earnings estimates and price changes.

This was another strong week, particularly for the Group, as shown by the last entries in the table. As Sam noted in a previous post, a lot of dark green this week in the 13 week rolling quarter. This good performance can also be viewed precisely by looking at the last price change column in the table. Also the green color coding of the SOX index for the last 13 weeks since 9/10 is showing only 2 down weeks for the index. The SOX made a new high for the year again this week taking out the old high of last week. In the last 13 weeks, the SOX is up just over 100 points.

The bottom table shows the continued rise of the PE and PEGs for the past couple of weeks. Even though the SOX is up over 100 points for the past 13 weeks, both the PE and PEG are arguably at relatively low numbers.

Earnings estimates for both the Group and the SOX went up this week after trending downward for several weeks. This action bears close watching to assess analyst sentiment.


The table shows the complete history of the SOX for the past year(and more). A weekly chart shows the same history with more visual information to easily see the up and down action throughout the year.

There are only 3 more weeks in calendar year 2010. Unless a sharp break occurs in the present 13 week uptrend, the action of 2010 in nearly history in terms of identifying 4 major trends over this past year.

Jan was a big down month(4 weeks) followed by a nice uptrend to the week closing Apr 23(12 weeks). Then a "wandering" downtrend occurred to the week ending 9/10(20 weeks) and then the past 13 week uptrend.

Report TOU ViolationShare This Post
 Public ReplyPrvt ReplyMark as Last ReadFilePrevious 10Next 10PreviousNext