In looking at the Monday's edition of IBD, an article was written about when to "get out" of a stock. This fits in with the 6 week look at the SOXM stocks shown earlier this weekend in:
Message 27162567
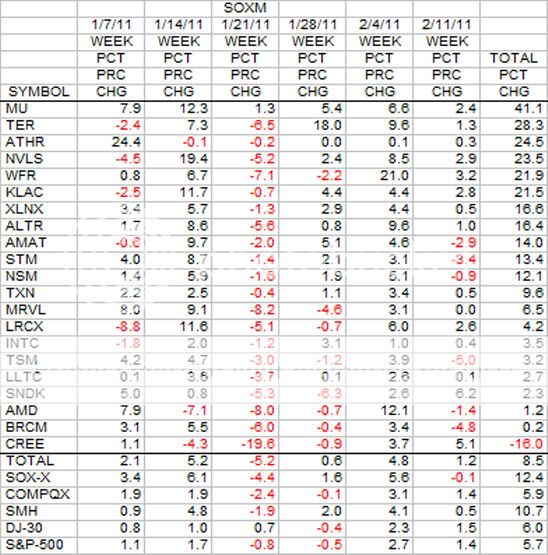
The table included in the post is repeated here for ease of review. CREE is at the bottom of the table with a 16 percent loss.
The IBD article can be found at
investors.com
Psych 105: Don't Hope, Hang On After A Stock's Peak
By ALAN R. ELLIOTT, INVESTOR'S BUSINESS DAILY
Posted 02/11/2011 05:42 PM ET
Resistance, in the investing trade, comes in different forms.
A stock can encounter external resistance. It attempts to push above levels where some shareholders opt to take profits, then falls. Investors, meanwhile, often wrestle the darker angels of what could be called an internal resistance; they see a stock flashing sell signals but feel compelled to ignore those signals and hold on.

Leading stocks warn astute investors that winning runs are about to end. Our brighter angels instruct us to mind those signs, reduce positions and finally sell all shares while the taking is good.
The more troublesome angel says, "There's more where that came from." He prods us to desire more milk and honey, even as a leader tops and starts to unravel.
Listen to the chart's message first. You never want big gains in your stock shrivel to dust.
LED chipmaker Cree (CREE) turned in a huge run after initially clearing a six month, cup-with-handle bottoming base in March 2009. It formed second-, then third-stage bases but kept running.
The stock was well past its third-stage breakout when it formed a three-weeks-tight in March 2010, and a whopping 276% above its initial buy point. Still, the stock broke out in strong trade April 5. It ran up an additional 15%, then paused.
The three days of plateaulike activity weren't exactly a sell signal. But the stock was 69% above its 200-day moving average. That is close enough to the 70%-100% warning range to raise an alert.
Cree backed off for the next two sessions in moderate trade. Then, the heavy-volume 7% drop on April 21 1 hung out a bright yellow flag (Click here to see the daily chart). The angels of caution warned that the stock was way past its third-stage base, living on borrowed time. The dark angels pointed to some heavy buying as Cree attempted to rebound.
But another big-volume dive May 20 2 handed the better angels the floor. Now it was clearly time to nail down gains. The stock was in its third week below 10-week support. Accumulation had converted to distribution. Even if you held a huge cushion, there was no telling which way shares would turn next.
The most pernicious demons of the investing trade might have stepped forward to offer their cool counsel. "C'mon," they'd say, "you've got a 190% cushion. You know this stock is coming back. Just hold through this correction."
An entranced investor may have held on, even as the stock shaped a sloppy three-month cup 3. But after forming a two-week handle, Cree itself became a fallen angel of sorts, dropping 43% off its peak 4. |


