I think there are a lot of tools around to help in stocks picking, but none of them are fool proof or we would all be "rich".LOL
As usual, I think of further things I could do to illuminate a situation after I have posted the first attempt. Here is my latest and hopefully the best on this subject of actual prices versus analyst target prices.
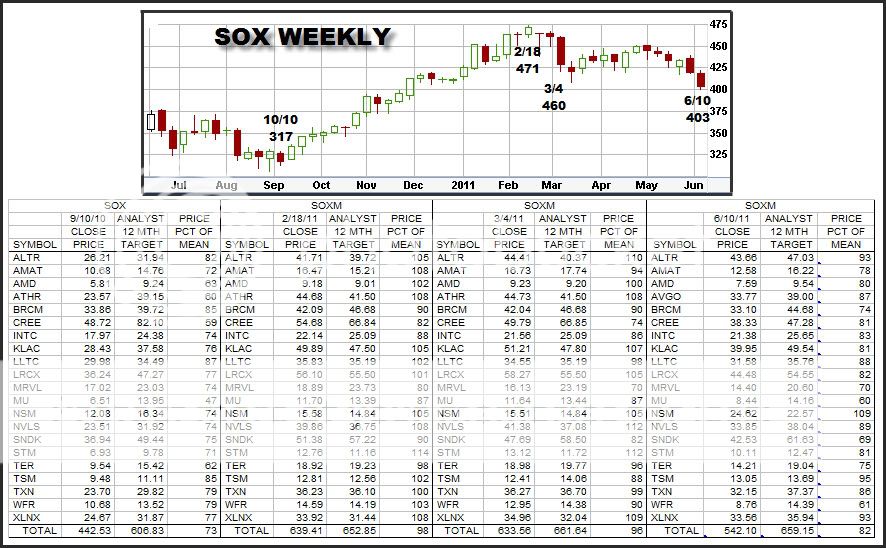
In this case I added the information from 10/10 to the previous table. The 4 dates in the table headings now correspond to the SOX chart along with the closing week value of the SOX index on that date.
Note in the 10/10 section of the table the very low bottom line value of percent(73) of actual to the analyst target price. Now going to the right, percent numbers increase as the SOX goes up to the 2/18 peak and then decrease to the 6/10 value(82) of last Friday. If history repeats, we still have a little further for the SOX to fall until another bottom is found around the 70 percent mark.
I think most importantly, consensus analyst estimates of 12 month targets do not change as fast as the SOX index and the individual stock prices therein. Having said that, the target numbers do change quite often in an up and down fashion as time progresses, but not as fast as the individual stock prices, they are not stagnant.
Just for fun, lets look at AMAT, WFR and SNDK. On 10/10 buy AMAT at 10.68, sell at 2/18 for 16.47, buy back now for 12.58. On 10/10 buy WFR for 10.68, sell on 2/18 for 14.59, and buy back now for 8.76. On 10/10 buy SNDK for 36.94, sell on 2/18 for 51.38, buy back now for 42.53.
 |


