The rich aren't getting away with tax murder...
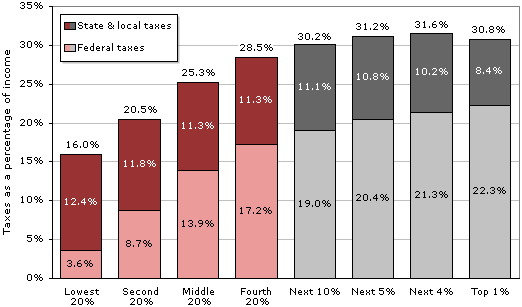
Citizens for Tax Justice, a research group that's been studying tax issues from its offices in Washington since 1979, provides the information we need. When all taxes (not just income taxes) are taken into account, the lowest 20% of earners (who average about $12,400 per year), paid 16.0% of their income to taxes in 2009; and the next 20% (about $25,000/year), paid 20.5% in taxes. So if we only examine these first two steps, the tax system looks like it is going to be progressive.
And it keeps looking progressive as we move further up the ladder: the middle 20% (about $33,400/year) give 25.3% of their income to various forms of taxation, and the next 20% (about $66,000/year) pay 28.5%. So taxes are progressive for the bottom 80%. But if we break the top 20% down into smaller chunks, we find that progressivity starts to slow down, then it stops, and then it slips backwards for the top 1%.
Specifically, the next 10% (about $100,000/year) pay 30.2% of their income as taxes; the next 5% ($141,000/year) dole out 31.2% of their earnings for taxes; and the next 4% ($245,000/year) pay 31.6% to taxes. You'll note that the progressivity is slowing down. As for the top 1% -- those who take in $1.3 million per year on average -- they pay 30.8% of their income to taxes, which is a little less than what the 9% just below them pay, and only a tiny bit more than what the segment between the 80th and 90th percentile pays.
What I've just explained with words can be seen more clearly in Figure 6.
Figure 6: Share of income paid as tax, including local and state tax  Source: Citizens for Tax Justice (2010a). Source: Citizens for Tax Justice (2010a).
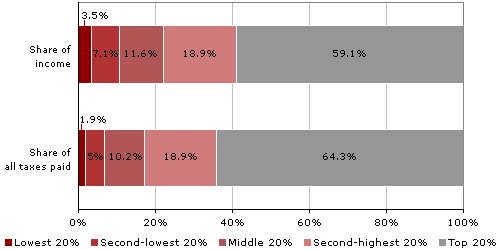
We also can look at this information on income and taxes in another way by asking what percentage of all taxes various income levels pay. (This is not the same as the previous question, which asked what percentage of their incomes went to taxes for people at various income levels.) And the answer to this new question can be found in Figure 7. For example, the top 20% receives 59.1% of all income and pays 64.3% of all the taxes, so they aren't carrying a huge extra burden. At the other end, the bottom 20%, which receives 3.5% of all income, pays 1.9% of all taxes.
Figure 7: Share of all income earned and all taxes paid, by quintile  Source: Citizens for Tax Justice (2010a). Source: Citizens for Tax Justice (2010a).
So the best estimates that can be put together from official government numbers show a little bit of progressivity. But the details on those who earn millions of dollars each year are very hard to come by, because they can stash a large part of their wealth in off-shore tax havens in the Caribbean and little countries in Europe, starting with Switzerland. And there are many loopholes and gimmicks they can use, as summarized with striking examples in Free Lunch and Perfectly Legal, the books by Johnston that were mentioned earlier. For example, Johnston explains the ways in which high earners can hide their money and delay on paying taxes, and then invest for a profit what normally would be paid in taxes. |


 Source: Citizens for Tax Justice (2010a).
  Source: Citizens for Tax Justice (2010a).