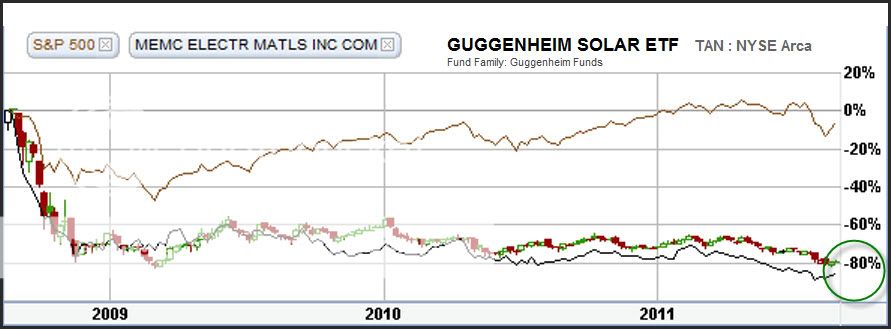
Here is a longer term look at the Solar stock(s) performance using ETF TAN fund as the baseline.
The chart starts on 15 Aug 2008, so the length is just over a 3 year period. TAN, starting around 25 dollars in Aug fell as low as 5 dollars in Nov 08 for about an 80 percent loss. Since then it recovered to about a 60 percent loss in 09, but since then it has been drifting downward to again reside at the -80 percent level.
Shown on the chart, the S&P-500 also dropped off starting in 08, but has since recovered to nearly the 08 level.
WFR also has a solar segment in the company and is shown for comparison to TAN. Its performance is similar to TAN, but even slightly worse.
Overall, for the past 3 years, the performance of the solar sector has been "awful", and who knows when it will rebound. We see articles all the time lately "slamming" this area for loss of gross margin, over supply, etc. You name it, and the market doesn't like it. Some day it may become a robust sector again, but who knows when that will be.
 |


