SI
SI
discoversearch

We've detected that you're using an ad content blocking browser plug-in or feature. Ads provide a critical source of revenue to the continued operation of Silicon Investor.  We ask that you disable ad blocking while on Silicon Investor in the best interests of our community.  If you are not using an ad blocker but are still receiving this message, make sure your browser's tracking protection is set to the 'standard' level.
Pastimes : Jacob's posts to save

 Public ReplyPrvt ReplyMark as Last ReadFilePrevious 10Next 10PreviousNext  
From: Jacob Snyder9/20/2011 11:49:27 PM
1 Recommendation  Read Replies (2) of 123
 
6 Signatures of recessions:
1. S&P 500 below its level of 6 months prior
2. employment: total nonfarm payrolls growth below 1% year-over-year
3. GDP growth below 2% year-over-year
4. Treasury yield curve flatter than 2.5% (10-year minus 3-month)
5. Junk Bond Spread: widening of credit spreads on corporate debt versus 6 months prior
6. ISM Purchasing Managers Index below 54

...100% sensitivity (these conditions have always been observed during or just prior to each U.S. recession)
and 100% specificity (the only time we observe the full set of these conditions is during or just prior to U.S. recessions).
Message 27615430

other charts, confirming recession:
7. initial jobless claims (reported weekly)
8. Oil price over $100, Brent
9. copper price falling
10. inflation rising
11. consumer confidence falling
12. VIX
13. Consumer disc./staples ratio falling

Long-term charts:
14. Inflation-adjusted S&P500
15. PE10
16. dividend yield
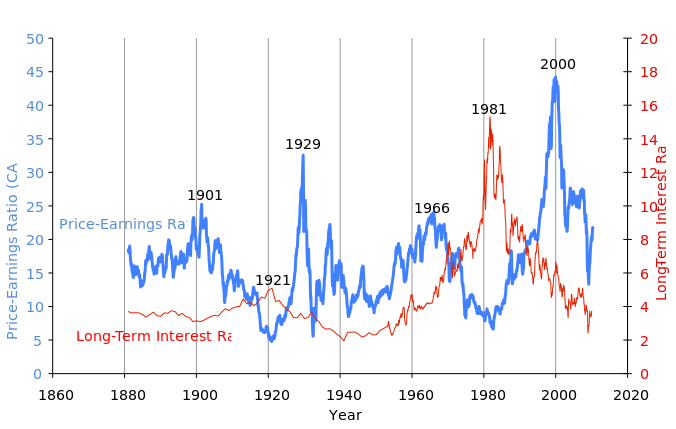
17. 130Y comparison of interest rates and stock valuations
18. Home Price Index, Shiller

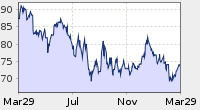
S&P 500 5Y:


Jobs: 110K/month increase = 1%/Y increase; reported on 1st Friday of each month
tradingeconomics.com
(131M = Total nonfarm payroll employment; 1.31M/12 = 109K

http://www.tradingeconomics.com/united-states/gdp-growth-annual

online.wsj.com

Yield curve:


Junk Bond Spread:
research.stlouisfed.org

online.wsj.com

Unemployment claims, reported weekly:


Oil Brent 1Y:
http://www.oil-price.net/


Inflation 3Y:

online.wsj.com

VIX 5Y:


Consumer disc./staples ratio 5Y:


Inflation-adjusted S&P500, since 1880:


PE10 of S&P500 (based on average inflation-adjusted earnings from the previous 10 years, by Shiller):


Dividend Yield, S&P500:


130Y comparison of interest rates and stock valuations:


Home Price Index, inflation adjusted, by Shiller:


Other sites:
Oil price Brent: livecharts.co.uk
multpl.com
multpl.com
Report TOU ViolationShare This Post
 Public ReplyPrvt ReplyMark as Last ReadFilePrevious 10Next 10PreviousNext