This is the last update for the table showing the results of the earnings reporting season for the 4th quarter of those stocks in the Group and SOXM that have CY/FY basis for reporting.
The table is very busy, and for that I apologize, but there is a lot of trend information contained therein. Also, I think it gives a good "flavor" for past behavior of earnings, and a good "snapshot" of what the market thinks about the future today for these stocks looking out through CY 2013. Earnings estimates are always changing as the weeks go by, but this is where we are today.
OK, I will try to hit some of the more important points shown in the table, so stick with me now.
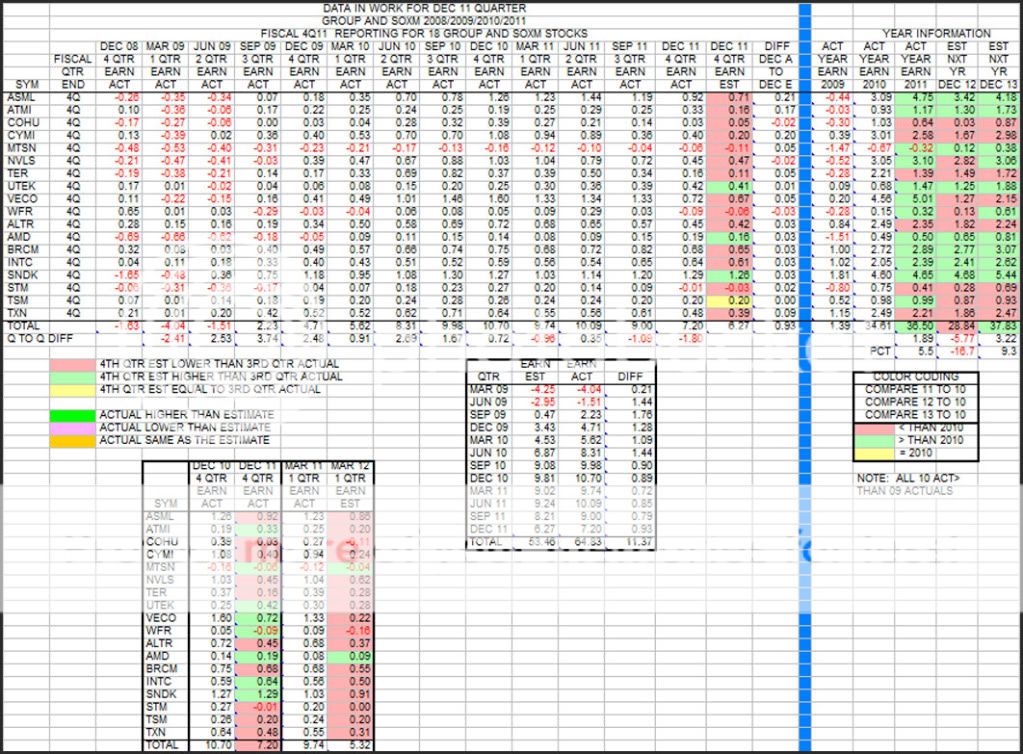
1. Look at the Dec quarterly numbers, both est and actual. The key for color coding of Dec estimates is shown to the top left below the table. At a glance you can see the Dec estimates were mostly lower than 3rd quarter actuals. Bottom line, the estimate for Dec was 6.27(-30%) versus the 9.00 actual for the Sep quarter. The actual for Dec was 7.20(-20%) compared to the 9.00 actual for Sep, and most importantly, down -33% compared to the 10.70 number for Dec 2010, 1 year back. So it is no wonder the SOX was in a downtrend most of the year after the week ending 2/18/11. The "market saw" the pullback in earnings that was coming.
2. Now let's drop to the smaller table at the lower left. This shows the actuals for each stock comparing Dec 11 to Dec 10 - the "winners and losers" in the first 2 columns. Then look at the last 2 columns taking special note of the bottom line. Look at the drop in estimated Mar 12 earnings of 5.32(-45%) compared to the Mar 11 actuals of 9.74. More downside ahead is estimated at the moment. Only MTSN and AMD have estimates higher than Mar 11 actuals.
3. Now let's go to the upper right of the table. Here 5 years of earnings are presented, 2009 through 2013. Look at the bottom line for all 5 years. 2009 to 2010 was the big recovery corresponding to good increases in stocks values. Earnings went from 1.39 to 34.61. Due to the falling earnings in the later part of 2011, the yearly number of 36.50 was only 5.5 percent higher than 2010. The present estimate for 2012 shows a drop of 5.17(-16.7%) compared to 2010. The 2013 number of 37.83 is up only 9.3 percent from the 2010 number which covers a period of 3 years.
 |


