Daily Presidential Tracking Poll
in Politics
Email this ShareThis ShareThis
Related Articles
Friday, April 13, 2012
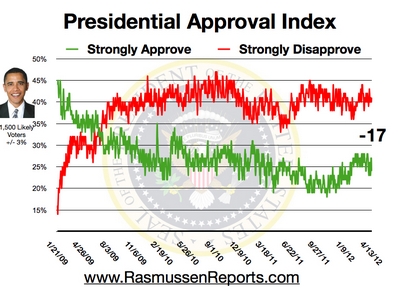
The Rasmussen Reports daily Presidential Tracking Poll for Friday shows that 24% of the nation's voters Strongly Approve of the way that Barack Obama is performing his role as president. Forty-one percent (41%) Strongly Disapprove, giving Obama a Presidential Approval Index rating of -17 ( see trends).
In a hypothetical Election 2012 matchup, Mitt Romney earns 48% of the vote, while President Obama attracts 44%. That's Romney's biggest advantage in over a month. Matchup results are updated daily at 9:30 a.m. Eastern (sign up for free daily e-mail update). See tracking history.
For all the talk about the War on Women and the gender gap, there is little difference in the gap between 2012 and 2008. Rasmussen Reports compiles tracking data on a full week basis to get a larger sample for demographic analysis and to observe long-term trends. For the week ending April 8, Romney led by six points among men, while Obama led by six points among women. That 12 point gender gap is identical to the gap in 2008. Exit polls showed Obama defeating McCain by 13 points among women and one point among men. Platinum Members can review the week by week numbers and the demographic crosstabs for each week’s results.
On economic issues, 49% of voters trust Romney more than Obama, while 39% trust the president. The candidates are fairly even on other key issues. Scott Rasmussen's weekly commentary looks at where the candidates stand as the general election gets underway. The numbers suggest the race in November could be very close.
Consumer confidence has fallen on six of the seven days since last week's disappointing jobs report. Overall, confidence has fallen nine points from 93.3 last Friday to 84.6 today. Just 30% now believe the economy is getting better, down from 35% a week ago. Fifty-one percent (51%) believe the economy is getting worse.
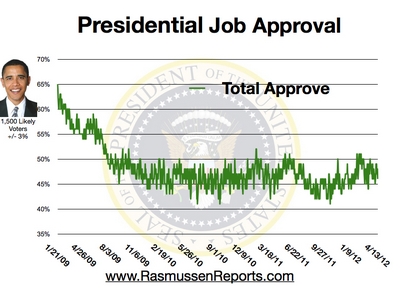
Overall, 46% of voters say they at least somewhat approve of the president's job performance. Fifty-one percent (51%) at least somewhat disapprove.
The WOR Radio Network has announced that it will begin syndicating daily features hosted by Scott Rasmussen starting next Monday. Three original one-minute editions of "The Rasmussen Report" will be made available to affiliates nationwide each weekday. They also will air on the network's flagship station News Talk Radio 710 WOR in New York City, including during The John Gambling Show , the market’s number-one morning-drive program.
Stations interested in carrying the program should contact the WOR Radio Network directly.
(More Below)
Twenty-nine percent (29%) believe the country is generally heading in the right direction.
Forty-four percent (44%) of Likely U.S. Voters now believe that the auto bailouts were good for the nation. Forty-seven percent (47%) take the opposite view and believe they were bad. Only 31% believe the financial industry bailouts were good for America.
If you’d like Scott Rasmussen to speak to your organization, meeting, or conference, please contact Premiere Speakers. The Wall Street Journal has called him “America’s leading insurgent pollster” and The Washington Post says Scott is a “driving force in American politics.”
Check out Scott’s New York Times bestseller, THE PEOPLE'S MONEY.
(More Below)
It is important to remember that the Rasmussen Reports job approval ratings are based upon a sample of likely voters. Some other firms base their approval ratings on samples of all adults. Obama's numbers are almost always several points higher in a poll of adults rather than likely voters. That's because some of the president's most enthusiastic supporters, such as young adults, are less likely to turn out to vote. It is also important to check the details of question wording when comparing approval ratings from different firms.
Rasmussen Reports has been a pioneer in the use of automated telephone polling techniques, but many other firms still utilize their own operator-assisted technology ( see methodology). Pollsters for Presidents Jimmy Carter and Bill Clinton have cited our " unchallenged record for both integrity and accuracy."
Learn more about the Rasmussen Reports track record over the years.
Daily tracking results are collected via telephone surveys of 500 likely voters per night and reported on a three-day rolling average basis. To reach those who have abandoned traditional landline telephones, Rasmussen Reports uses an online survey tool to interview randomly selected participants from a demographically diverse panel. The margin of sampling error for the full sample of 1,500 Likely Voters is +/- 3 percentage points with a 95% level of confidence. Results are also compiled on a full-week basis and crosstabs for full-week results are available for Platinum Members.
Like all polling firms, Rasmussen Reports weights its data to reflect the population at large ( see methodology). Among other targets, Rasmussen Reports weights data by political party affiliation using a dynamic weighting process. While partisan affiliation is generally quite stable over time, there are a fair number of people who waver between allegiance to a particular party or independent status. Our baseline targets are established based upon separate survey interviews with a sample of adults nationwide completed during the preceding three months (a total of 45,000 interviews) and targets are updated monthly. Currently, the baseline targets for the adult population are 36.1% Republicans, 32.8% Democrats, and 31.1% unaffiliated. Likely voter samples typically show a slightly larger advantage for the Republicans. |


