SI
SI
discoversearch

We've detected that you're using an ad content blocking browser plug-in or feature. Ads provide a critical source of revenue to the continued operation of Silicon Investor.  We ask that you disable ad blocking while on Silicon Investor in the best interests of our community.  If you are not using an ad blocker but are still receiving this message, make sure your browser's tracking protection is set to the 'standard' level.
Technology Stocks : Semi Equipment Analysis
SOXX 299.67+1.5%Nov 12 4:00 PM EST

 Public ReplyPrvt ReplyMark as Last ReadFilePrevious 10Next 10PreviousNext  
To: Donald Wennerstrom who wrote (56485)6/3/2012 5:06:59 PM
From: Donald Wennerstrom3 Recommendations  Read Replies (1) of 95406
 
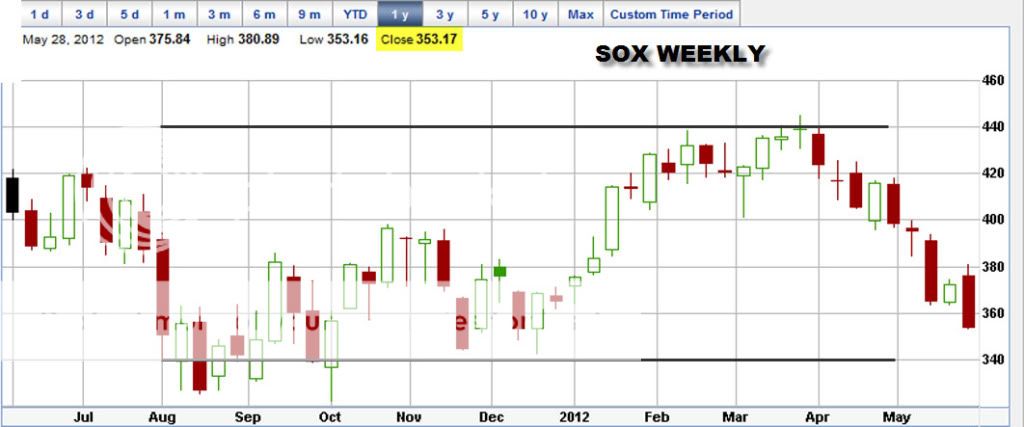
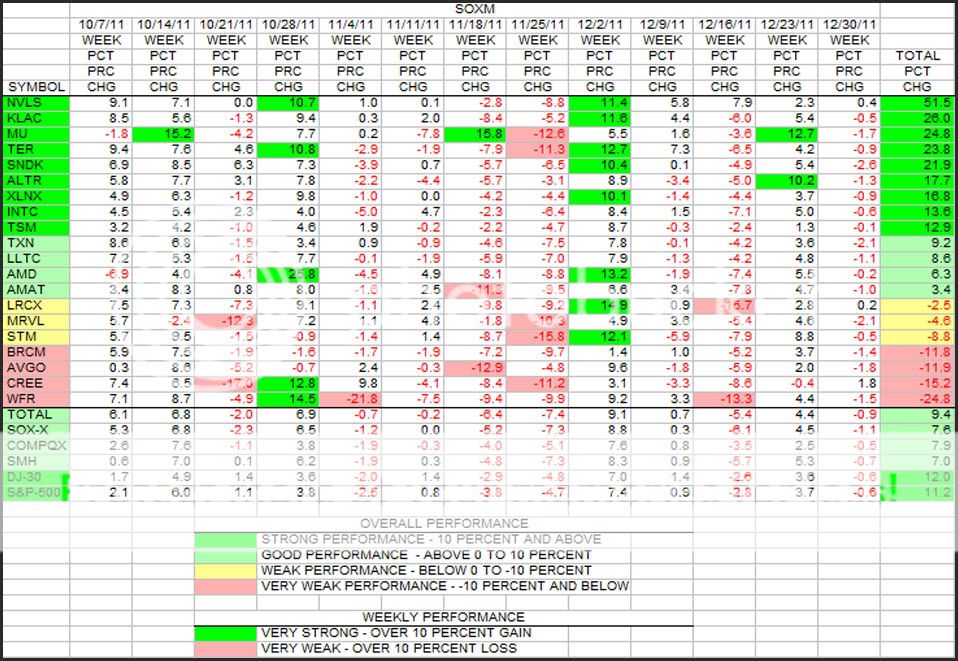
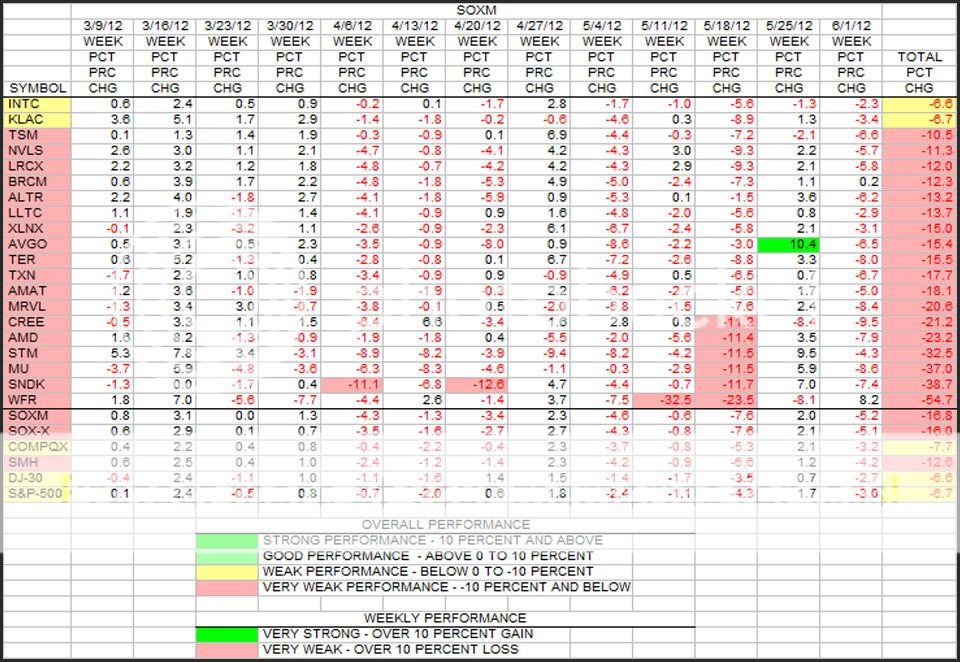
Let's look at the entire period discussed in the last post from the beginning of Oct 2011 to the present. First, the overview SOX chart from the last post, and then the 13 week rolling tables from the last quarter of 2011, the 1st quarter of 2012, and then the table showing the last 13 weeks which repeats 4 weeks from the 1st quarter, but shows the 9 following weeks. We have 4 weeks left to go in the 2nd calendar quarter. June 30 is a Saturday which ends the 2nd quarter.

The last fall quarter shows the surge for the month of October very well, then the negative Nov, and then the starting surge in Dec. For the quarter, the DOW and S&P were up over 10 percent. The "pundits" did a nice job of goosing the markets. Of course the Fed helped as well, big time.

Now the 13 weeks of the 1st quarter really "roared". These 13 weeks added to the last 2 weeks in Dec provided the 24 percent gain for the SOX stated in the last post. The individual and bottom line numbers were "fantastic". The DOW and S&P were up another 8.1 and 12 percent. Seventeen of the 20 stocks were up over 10 percent.

Then we come to the present period. Here we show the overlap of the past 4 weeks in March followed by the next 9 weeks showing the present steep decline. Even with the strong up 4 weeks in March influencing the 13 week numbers, 18 of the 20 stocks are down over 10 percent. Only 1 green bar in the whole table which is AVGO with a gain of 10.4 percent the week of 5/25.


Report TOU ViolationShare This Post
 Public ReplyPrvt ReplyMark as Last ReadFilePrevious 10Next 10PreviousNext