OT: Here is another one. An excerpt below.
Is the Stock Market Cheap?
By Doug Short
July 2, 2012
advisorperspectives.com
The P/E10 Ratio
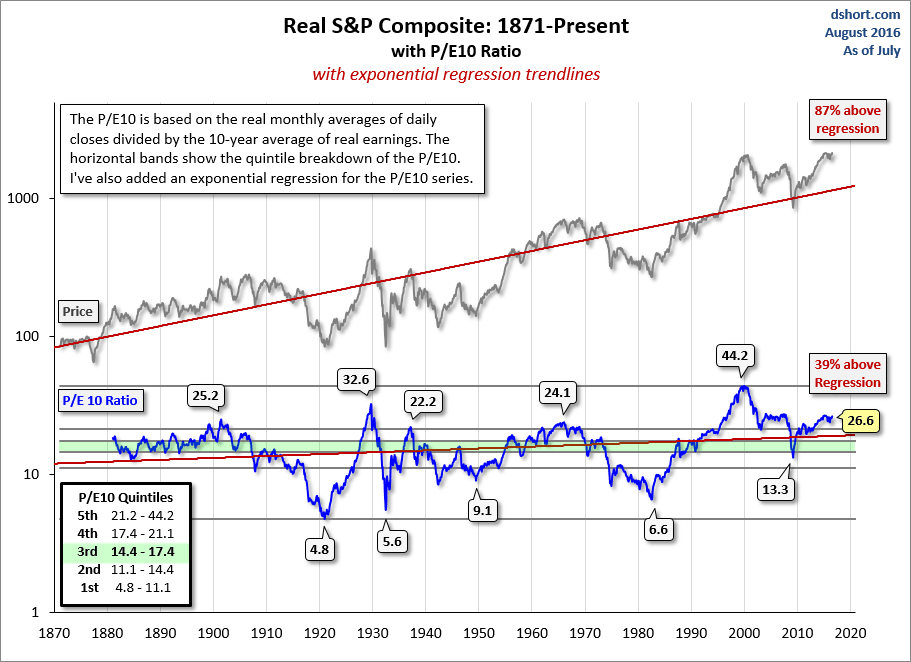
Legendary economist and value investor Benjamin Graham noticed the same bizarre P/E behavior during the Roaring Twenties and subsequent market crash. Graham collaborated with David Dodd to devise a more accurate way to calculate the market's value, which they discussed in their 1934 classic book, Security Analysis. They attributed the illogical P/E ratios to temporary and sometimes extreme fluctuations in the business cycle. Their solution was to divide the price by a multi-year average of earnings and suggested 5, 7 or 10-years. In recent years, Yale professor Robert Shiller, the author of Irrational Exuberance, has reintroduced the concept to a wider audience of investors and has selected the 10-year average of "real" (inflation-adjusted) earnings as the denominator. As the accompanying chart illustrates, this ratio closely tracks the real (inflation-adjusted) price of the S&P Composite. The historic average is 16.4. Shiller refers to this ratio as the Cyclically Adjusted Price Earnings Ratio, abbreviated as CAPE, or the more precise P/E10, which is my preferred abbreviation.
The Current P/E10
After dropping to 13.3 in March 2009, the P/E10 rebounded to an interim high of 23.5 in February of last year and is now at 20.5. The next chart gives us a historical context for these numbers. The ratio in this chart is doubly smoothed (10-year average of earnings and monthly averages of daily closing prices). Thus the fluctuations during the month aren't especially relevant (e.g., the difference between the monthly average and monthly close P/E10).
 |


