Daily Presidential Tracking Poll
in Politics
Email this ShareThis ShareThis
Related Articles
Saturday, July 28, 2012
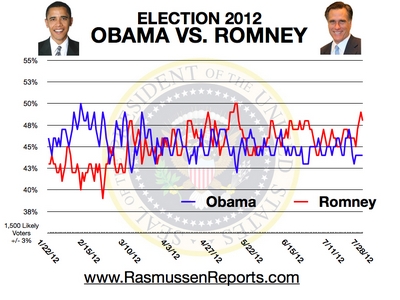
The Rasmussen Reports daily Presidential Tracking Poll for Saturday shows Mitt Romney attracting 48% of the vote, while President Obama earns support from 44%. Four percent (4%) prefer some other candidate, and four percent (4%) are undecided.
Romney’s has lead by four or five points for three consecutive days. That’s the largest advantage enjoyed by either candidate in over a month. As with any such change in the race, it remains to be seen whether it marks a lasting shift or is merely statistical noise. See tracking history.
Matchup results are updated daily at 9:30 a.m. Eastern (sign up for free daily e-mail update).
In state polling, new numbers show the president with a three-point lead in Wisconsin. He also leads by five in Nevada and six in Michigan. All three states were won by Obama in 2008 and are considered potential swing states this year. The Rasmussen Reports Electoral College Projections show Obama likely to win states with 201 Electoral College Votes while Romney is likely to win in states with 170.
Most voters believe the president’s health care law will cause some companies to drop the health insurance they provide for their employees. Just 23% think it would be good for employees if their company dropped their insurance coverage and they were enrolled instead in a government-sponsored health insurance plan. Fifty percent (50%) say that would be bad for the employees. Republicans and unaffiliated voters overwhelmingly hold that view. A plurality of Democrats disagree and believe workers would be better off on a government plan.
Check out our review of this past week’s key polls to see “What They Told Us.”
(Presidential Job Approval Data Below)
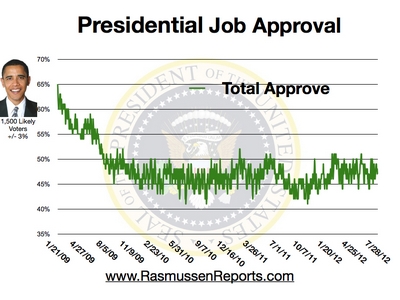
A president’s Job Approval rating is one of the best indicators for assessing his chances of reelection. Typically, the president’s Job Approval rating on Election Day will be close to the share of the vote he receives. Currently, 47% of voters say they at least somewhat approve of the president's job performance. Fifty-three percent (53%) at least somewhat disapprove ( see trends).
Seventy percent (70%) of voters see Obama as politically liberal, while 67% see Romney as a conservative. However, the president is seen as more extreme ideologically. Forty-three percent (43%) see him as Very Liberal, while just 24% believe Romney is Very Conservative. Most voters are either politically Moderate or Somewhat Conservative. Sixty-two percent (62%) place Romney in that group while just 25% say the same for Obama.
In his weekly newspaper column, Scott Rasmussen notes that the declining economy is hurting the president’s reelection prospects. He points out that when President Bush was reelected in 2004 his summer job approval rating was similar to Obama’s. However, in 2004, the underlying trends were moving in his direction. “The big issue that year was the war on terror. In the summer of 2004, just 44 percent thought the United States and its allies were winning that war. In the five weeks running up to the election, however, confidence that our side was winning ranged from 49 percent to 52 percent.”
Rasmussen concludes that for Obama to win, “he will need to improve his own job approval rating between now and Election Day. For that to happen, perceptions of the economy will have to reverse their current downward trend.”
If you’d like Scott Rasmussen to speak to your organization, meeting, or conference, please contact Premiere Speakers.
(Approval Index data below)
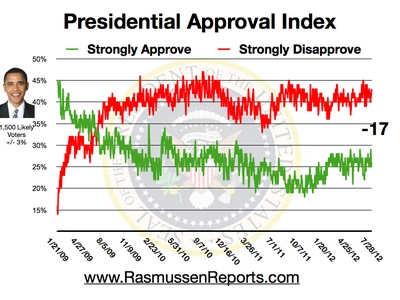
Intensity of support or opposition can have an impact on campaigns. Currently, 26% of the nation's voters Strongly Approve of the way Obama is performing as president. Forty-two percent (43%) Strongly Disapprove, giving him a Presidential Approval Index rating of -17 ( see trends).
During midterm elections, intensity of support can have a tremendous impact on turnout. That was demonstrated in 2010 when Republicans and unaffiliated voters turned out in large numbers to express opposition to the Obama administration’s policies. However, in presidential election years, there is a smaller impact on turnout.
To get a sense of longer-term Job Approval trends for the president, Rasmussen Reports also compiles our tracking data on a full month-by-month basis.
(More below)
Rasmussen Reports is a media company whose work is followed by millions on a wide variety of platforms. We regularly release our results at RasmussenReports.com, through a daily email newsletter, a nationally syndicated radio news service, an online video service and a weekly newspaper column distributed by Creators Syndicate. A nationally syndicated TV show-- What America Thinks --is scheduled for launch in September 2012.
Our firm has been a pioneer in the use of automated telephone polling techniques, but many other firms still utilize their own operator-assisted technology ( see methodology). Pollsters for Presidents Jimmy Carter and Bill Clinton have cited our " unchallenged record for both integrity and accuracy." During Election 2008, Rasmussen Reports projected that Barack Obama would defeat John McCain by a 52% to 46% margin. Obama was 53% to 46%. In 2004, Rasmussen Reports was the only firm to project the vote totals for both candidates within half a percentage point. Learn more about the Rasmussen Reports track record over the years.
Daily tracking results are collected via telephone surveys of 500 likely voters per night and reported on a three-day rolling average basis. To reach those who have abandoned traditional landline telephones, Rasmussen Reports uses an online survey tool to interview randomly selected participants from a demographically diverse panel. The margin of sampling error for the full sample of 1,500 Likely Voters is +/- 3 percentage points with a 95% level of confidence. Results are also compiled on a full-week basis and crosstabs for full-week results are available for Platinum Members. |


