Kirk,
I don't have an easy way of getting a curve of earnings on the chart with the SOX, but I did make another way of presenting the data.
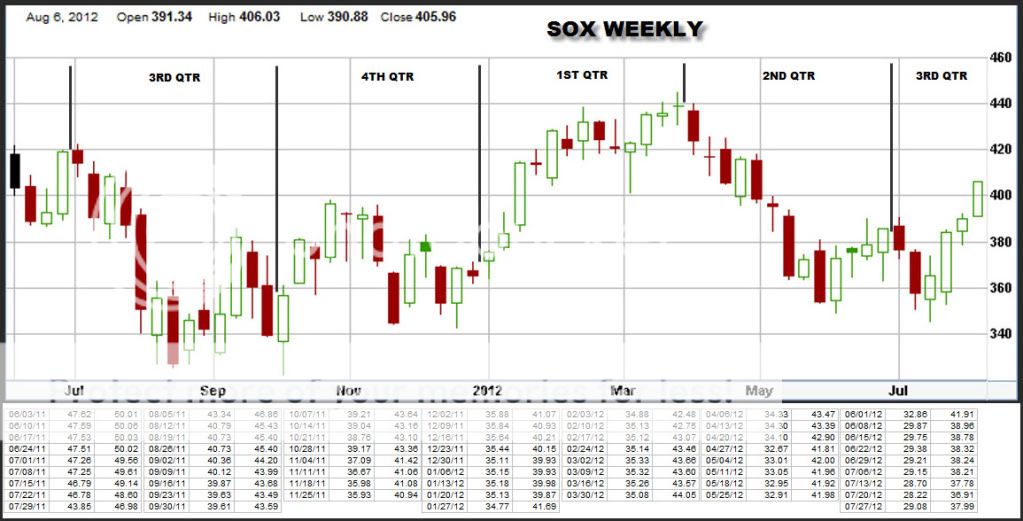
Just below the SOX candlestick chart, I added a tabular listing of Cur Yr and Nxt Yr earnings in 2 month increments that corresponds fairly close to the SOX curve. This allows a comparison of 2 month increments to each region of interest.
First of all, I would note that over the coverage of a little over a year, the SOX has a nearly perfect oscillating motion in a sideways direction. Starting in June 2011, the SOX was in the 400 to 420 region. At that point, Cur Yr and Nxt Yr earnings were in the high 40's. In Jul 2011 a small down turn in estimates began. In Aug/Sept estimates continued down and the SOX went lower as well to the 330 to 360 area.
In Oct 2011, estimates stayed about the same while the SOX increased to the 380/390 area. Then in Nov, estimates decreased slightly along with the SOX down to the 350 area. Going to Dec/Jan, estimates stayed about the same, but the SOX went from about 345 to 415 - a real divergence.
In Feb/Mar, estimates rose slightly while the SOX went from about 415 to 438.64 where an interim peak was established the week of 3/30. Also of note, Nxt Yr earnings also peaked that week at 44.05.
Heading into Apr and May, the SOX began a down slide as well as the earnings estimates began a slight down trend. Over that period, the SOX went from 438.64 to bottom the week ending 6/1 at 353.17. A nasty pullback while the estimates were on a rather small pullback.
Now we enter the last 2 months. Estimates have continued their down trend started in Apr/May, but the SOX has been on an up trend and now just at the 400 area again. Another divergence.
What has happened over the past roughly 14 months, the SOX is about the same at 400 at both ends of the chart while the estimates have gone from 47.62 and 50.01 at the beginning of the chart to 29.08 and 37.99 at the present time. This of course means that the PEs and PEGs of the stocks involved are at a much higher level now than 14 months ago. Do we go up from here? I don't think so, at least not in any extended way for the foreseeable future.
 |


