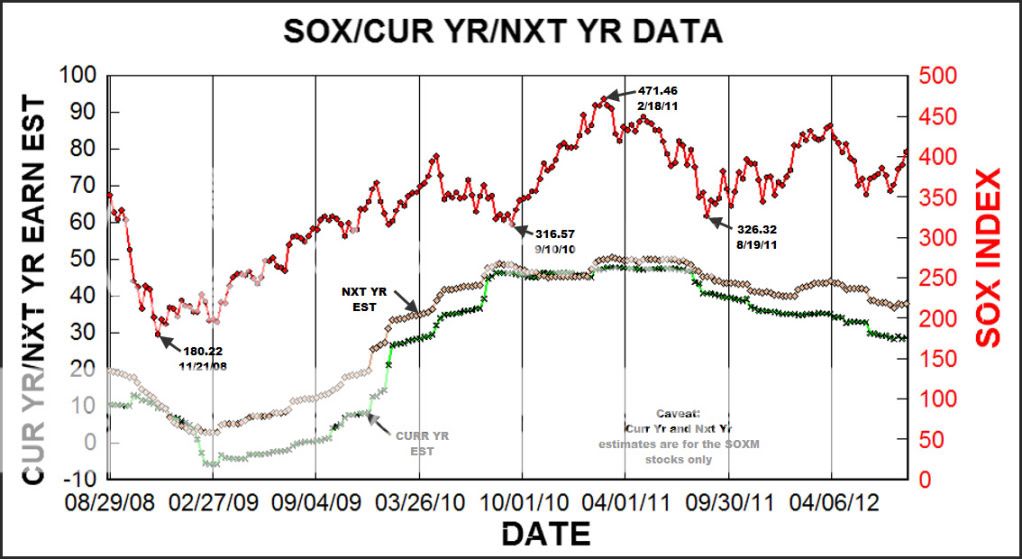
OK, you asked for it, you got it. A graphic comparison of the SOX index to the Curr Yr and Nxt year earnings estimates for the SOXM stocks. The data begins with the first entry in the Group and SOXM(SOX) tables posted weekly and ends with yesterday's posting. Incidentally, when the next 2 week postings are completed, the data in the table will run from 8/29/08 to 8/31/12, a period of 4 years.
Each symbol point on each curve corresponds to a data point in the table.
Beginning with 8/29/08, the curve of course doesn't show it, but the SOX was already coming down hard, however the estimates were still holding up fairly well. Twelve weeks later from 8/29, the SOX bottomed at 180.22 the week of 11/21. While the SOX started rebounding from that point, the earnings estimates kept falling until the end of Feb 09. So we have a period there of about 3 months where the SOX was trending upward slightly while the earnings estimates were going down. Note that Curr Yr earnings went negative during this period.
From Feb 09 to Apr 10, a period of about 14 months, both the SOX and estimates were in synch, trending upward. In Apr 10, the SOX hit a temporary peak of 400.42 and began a downtrend until 9/10/10, a period of 19 weeks until it hit a low of 316.57. During this period, the estimates were still trending upward to a plateau, therefore this was another period of divergence.
From 9/10, the SOX began a sharp uptrend to 2/18/11, a period of about 5 months where it peaked at 471.46, a gain of 154.89 or plus 49 percent. In the meantime during this period, the estimates were on a plateau and changed very little. A big divergence during this period. The interesting thing is, the SOX turned around at this point and proceeded back down to nearly the identical point of its value of 316.57 on 9/10 to 326.32 on 8/19/11, nearly a year later. The estimates during this entire time were essentially on a plateau and changed very little. Again we have a divergence.
Finally, continuing on from 8/19/11 which is essentially a year ago this weekend, estimates have been trending downward while the SOX has been in a slow uptrend. The SOX closed at 405.14, a gain of 78.82 or plus 24 percent, while the estimates are down from 8/19/11(40.73, 45.40) to 8/17/12(28.55, 37.64), a difference of 12.18(-30%) and 7.76(-17%).
So in summary, the SOX has been on an uptrend, and the estimates have been on a downtrend for the past year. Another divergence. Also of course, this action has been evident for some time with the weekly postings of increasing PEs and PEGs. This market wants to go up irrespective of the earnings picture.
 |


