This post is about taking a little trip down memory lane, and noting a couple of issues.
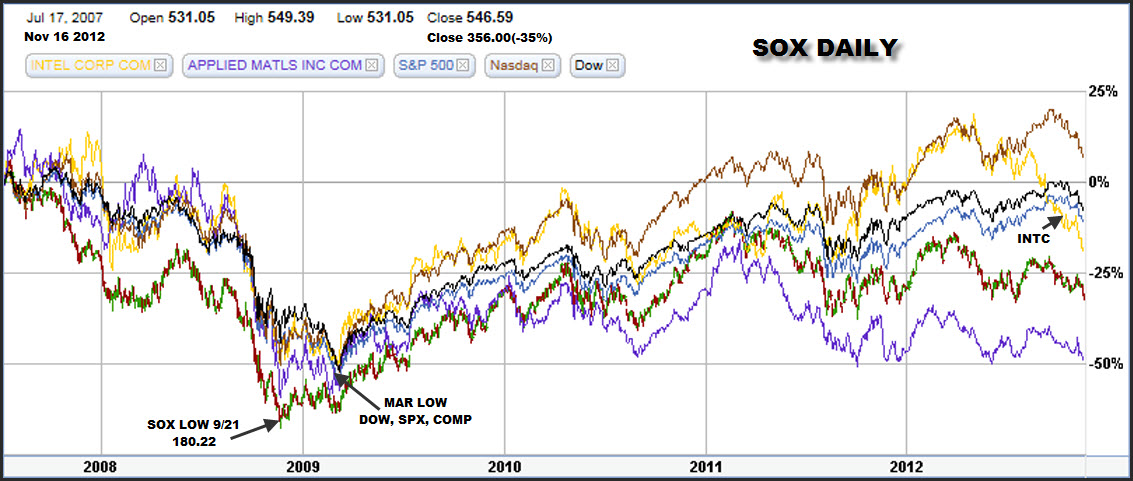
The starting point for this trip is July 17, 2007. That was the last major interim high for the SOX at 546.59. The next major point is Nov 21, 2008 when the SOX bottomed at 180.22, down 67 percent in a period of about 16 months. The DOW, SPX, and COMP were following along on the downtrend, but did not bottom until March 2009. The SOX was mostly flat from Nov to Mar, but it did not hit a new low.
Since Mar 2009, a stock and index recovery has been underway, but not all have been at an equal pace. The COMP has done the best and is the only one with a positive position since Jul 2007 with about a 5 percent gain over the period. With Friday's close of 356.00, the SOX is down 35 percent from Jul 2007. AMAT is down nearly 50 percent.
INTC was doing very well in the recovery until early May of this year when it reached about 29 dollars a share. This past Friday it closed at 20.19 or down about 9 dollars a share since May. The chart shows the sharpness of the falloff. In May it was close to 15 percent positive, now it is down close to 20 percent negative.
By just "eyeballing" the chart, you can see, first the downtrend starting for AMAT in Feb earlier this year, followed by the SOX in Mar, and then INTC in May. The COMP, while still positive, started down in Sept. The DOW and SPX were "flatlining" in Sept and started down in Oct. At the moment, all curves on the chart are on a steep downtrend.
There are many World and U.S. events that are having an impact on the market right now. How these events will all turn out remain to be seen, but IMO the likely outcome will continue to put downside pressure on stock prices. While all these long term trends remain to be sorted out, shorter term trading opportunities should continue as they have over the past 4 to 5 years. Those of us who follow the 13 week rolling quarter tables on a weekly basis should be able to spot some short term trading opportunities.
 |


